Alluvial chart
info
Charts are available with Avalonia Pro.
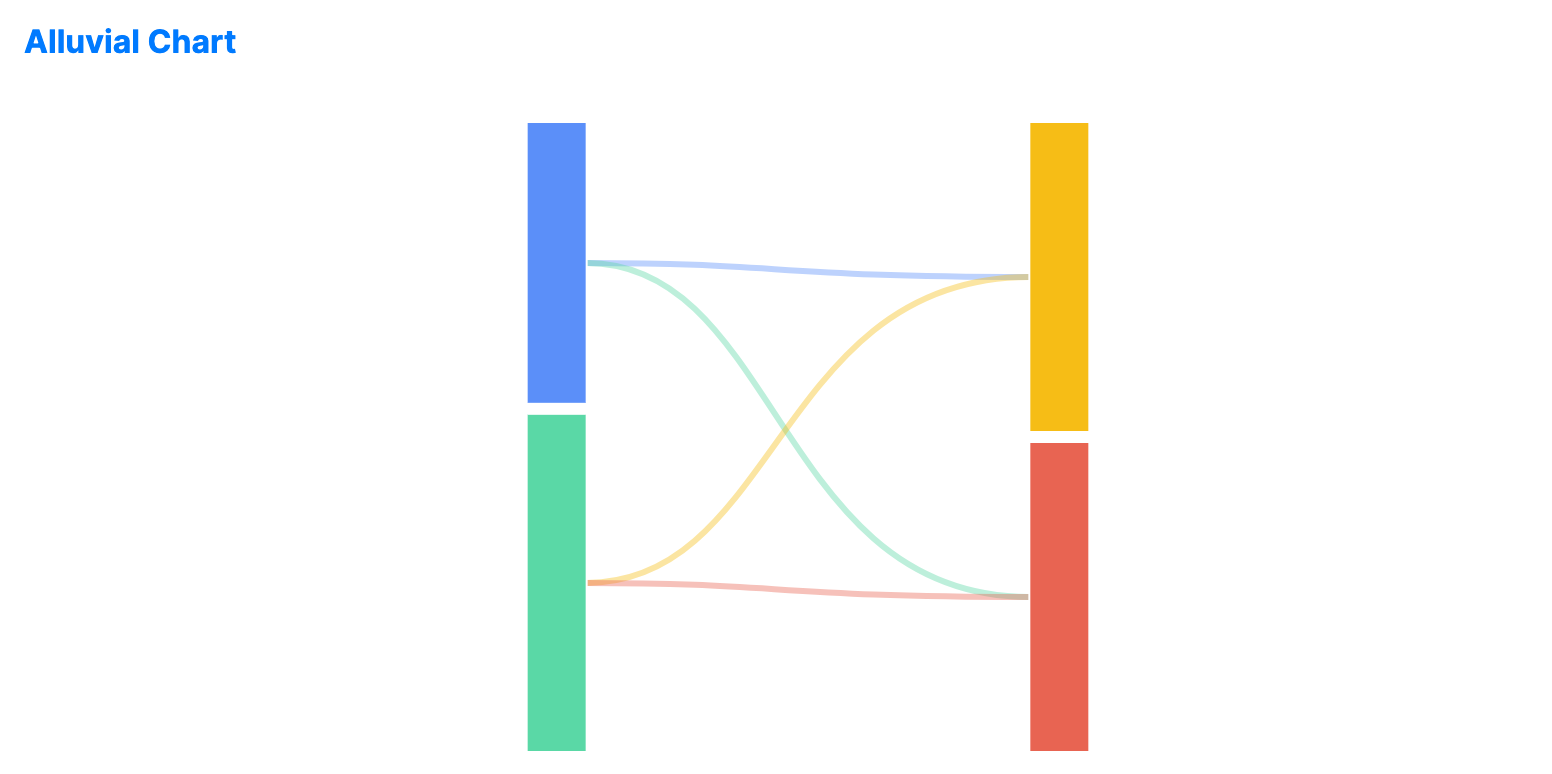
Alluvial charts represent changes in structure over time or across categories. They are similar to Sankey diagrams but are typically organized into distinct vertical columns.
When to use
- Workflow analysis: Tracking how items move through sequential process stages.
- Categorical flow: Visualizing how members of one category belong to others (e.g., voters' changing affiliations).
- Structural shifts: Showing how a population's grouping changes between two points in time.
Code example
XAML
<AlluvialChart xmlns="https://github.com/avaloniaui" Name="AlluvialChartSample" Title="Category Flow" Height="350"
                        Nodes="{Binding AlluvialNodes}"
                        Links="{Binding AlluvialLinks}" />
Data model (C#)
public ObservableCollection<AlluvialNode> AlluvialNodes { get; } = new()
{
    new() { Id = "Jan", Label = "Jan", Step = 0, Value = 50 },
    new() { Id = "Feb", Label = "Feb", Step = 0, Value = 60 },
    new() { Id = "CatA", Label = "Category A", Step = 1, Value = 55 },
    new() { Id = "CatB", Label = "Category B", Step = 1, Value = 55 }
};

public ObservableCollection<AlluvialLink> AlluvialLinks { get; } = new()
{
    new() { Source = "Jan", Target = "CatA", Value = 30 },
    new() { Source = "Jan", Target = "CatB", Value = 20 },
    new() { Source = "Feb", Target = "CatA", Value = 25 },
    new() { Source = "Feb", Target = "CatB", Value = 35 }
};
AlluvialChart uses the strongly typed AlluvialNode and AlluvialLink classes. Each node defines an Id, Label, Step, and Value.
Common properties
| Property | Description | Default |
|---|---|---|
Nodes | The collection of categorical nodes (columns). | null |
Links | The collection of connections between nodes. | null |