Bubble map
info
Charts are available with Avalonia Pro.
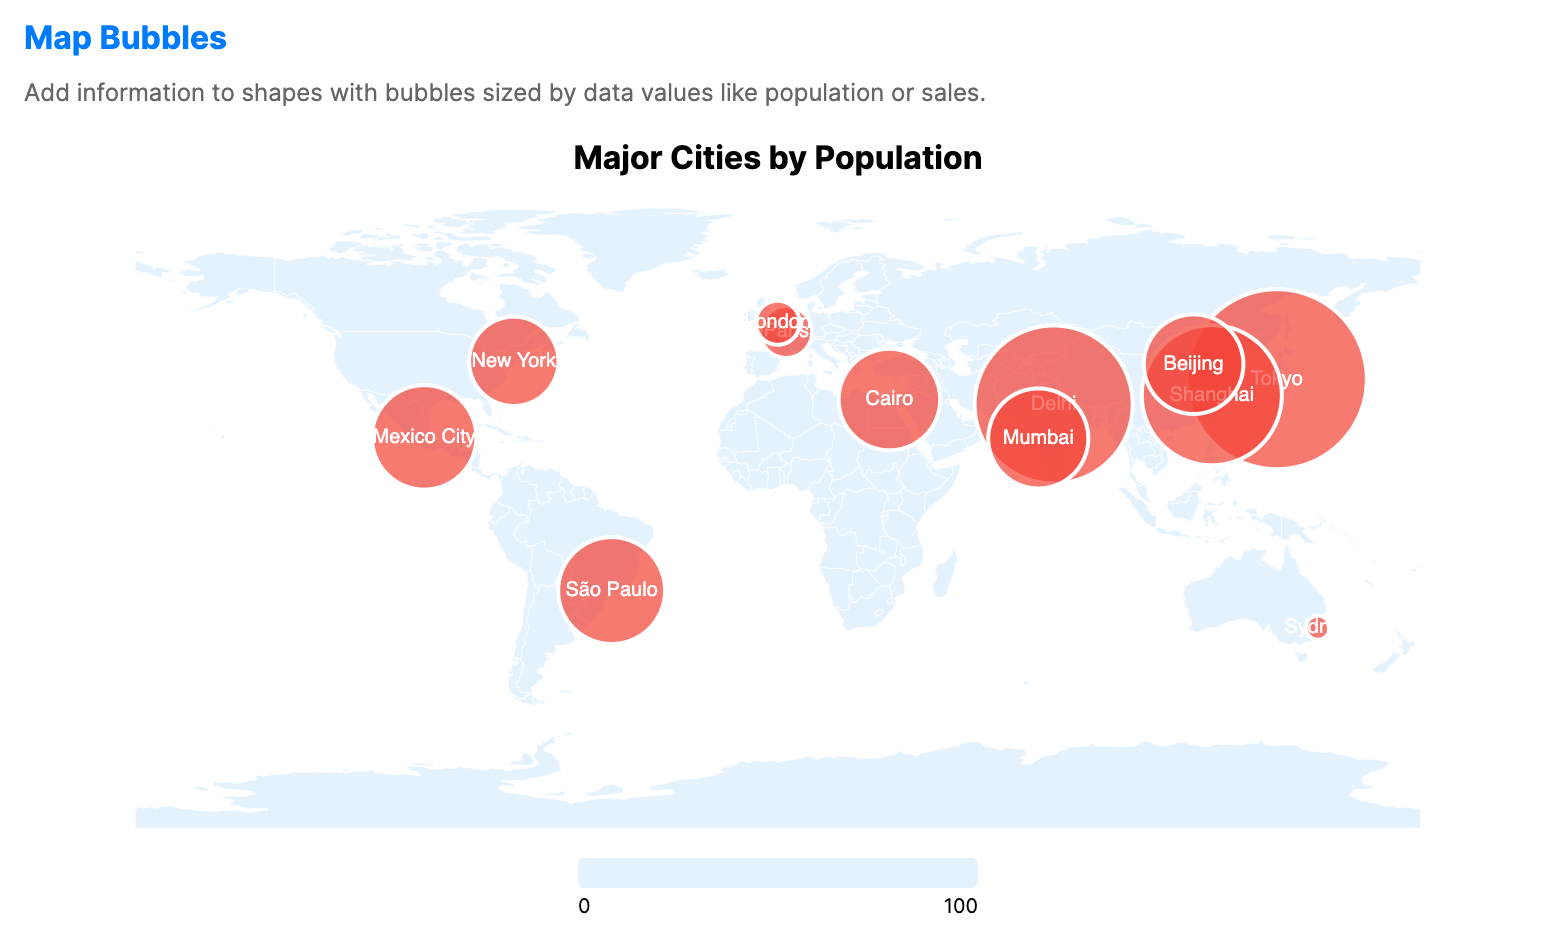
Bubble maps use circles of different sizes to represent data values over geographic regions, using ShapeMap as a basis to display a ShapeLayer with a superimposed BubbleLayer. They show locality and value magnitude in the same view.
When to use
- Event distribution: Mapping the location and scale of occurrences (e.g., earthquakes, sales events).
- Urban statistics: Comparing populations or activity levels across specific cities.
- Global indicators: Visualizing country-level data where the size of the bubble represents the value.
Code example
XAML
<ShapeMap xmlns="https://github.com/avaloniaui" Name="BubbleSample" Title="Major Cities by Population" Height="400" ShowLegend="True" LegendPosition="Bottom">
                        <ShapeMap.Layers>
                            <ShapeLayer GeoJson="{Binding WorldGeoJson}"
                                                 GeoJsonIdPath="ISO_A2"
                                                 LowBrush="#E3F2FD"
                                                 HighBrush="#E3F2FD"
                                                 StrokeThickness="0.3" />
                            <BubbleLayer LatitudePath="Lat"
                                                  LongitudePath="Lon"
                                                  SizePath="Population"
                                                  LabelPath="City"
                                                  MinBubbleSize="6"
                                                  MaxBubbleSize="45"
                                                  Fill="#B4F44336"
                                                  ShowLabels="True"
                                                  ItemsSource="{Binding CityBubbles}">
                                <BubbleLayer.TooltipTemplate>
                                    <DataTemplate>
                                        <StackPanel Spacing="4">
                                            <TextBlock Text="{Binding City}" FontWeight="Bold"/>
                                            <TextBlock Text="{Binding Population, StringFormat='Pop: {0:N1}M'}"/>
                                        </StackPanel>
                                    </DataTemplate>
                                </BubbleLayer.TooltipTemplate>
                            </BubbleLayer>
                        </ShapeMap.Layers>
                    </ShapeMap>
Data model (C#)
Ensure the GeoJSON file is included in your project and available at the specified relative path at runtime.
using System.IO;

public record CityData(string City, double Lat, double Lon, double Population);

public string WorldGeoJson { get; } =
    File.ReadAllText("Resources/ne_110m_world.geojson");

public CityData[] CityBubbles { get; } = new CityData[]
{
    new("Tokyo", 35.7, 139.7, 37.4),
    new("Delhi", 28.6, 77.2, 32.9),
    new("Shanghai", 31.2, 121.5, 29.2),
    new("São Paulo", -23.5, -46.6, 22.4),
    new("Mexico City", 19.4, -99.1, 21.9),
    new("Cairo", 30.0, 31.2, 21.3),
    new("Mumbai", 19.1, 72.9, 21.0),
    new("Beijing", 39.9, 116.4, 20.9),
    new("New York", 40.7, -74.0, 18.8),
    new("London", 51.5, -0.1, 9.5),
    new("Paris", 48.9, 2.3, 11.1),
    new("Sydney", -33.9, 151.2, 5.4)
};
Common properties: ShapeLayer
| Property | Description | Default |
|---|---|---|
GeoJson | GeoJSON data. | null |
Source | URI for the source of the GeoJSON data. | null |
GeoJsonIdPath | Unique ID of the GeoJSON data. | null |
ItemsSource | Data collection containing map regions. | null |
RegionPath | Property linking data to GeoJSON coordinates. | null |
ValuePath | Property linking data to region values. | null |
MinValue | Minimum value for color normalization. | 0.0 |
MaxValue | Maximum value for color normalization. | 100.0 |
LowBrush | Color representing the lowest data value. | #E3F2FD |
HighBrush | Color representing the highest data value. | #1565C0 |
Stroke | Color of region outlines. | null |
StrokeThickness | Thickness of region outlines. | 0.5 |
ShowLabels | Whether to display labels on regions. | false |
LabelPath | Path of the label text. | null |
LabelForeground | Brush used for region labels. | null |
SelectionMode | Selection mode for selecting regions. Use None, Single, SingleDeselect, or Multiple. | None |
SelectionBrush | Color of selected regions. | #FFC107 |
SelectionStroke | Color of the outline of selected regions. | null |
SelectionStrokeThickness | Thickness of the outline of selected regions. | 2.0 |
SelectedItem | The currently selected region. | null |
HoverBrush | Brush used when a region is hovered. | White at 30% opacity |
Common properties: BubbleLayer
| Property | Description | Default |
|---|---|---|
ItemsSource | Data source for bubbles. | null |
LatitudePath | Property path for latitude coordinates. | null |
LongitudePath | Property path for longitude coordinates. | null |
SizePath | Size of bubbles. | null |
PointBrushPath | Optional property path that supplies a brush or color per bubble. | null |
ShowLabels | Whether to display labels over bubbles. | true |
LabelPath | Content of labels. | null |
MinBubbleSize | Minimum bubble radius. | 8.0 |
MaxBubbleSize | Maximum bubble radius. | 40.0 |
Fill | Color of bubbles. | null |
Stroke | Color of bubble outlines. | null |