Gantt chart
info
Charts are available with Avalonia Pro.
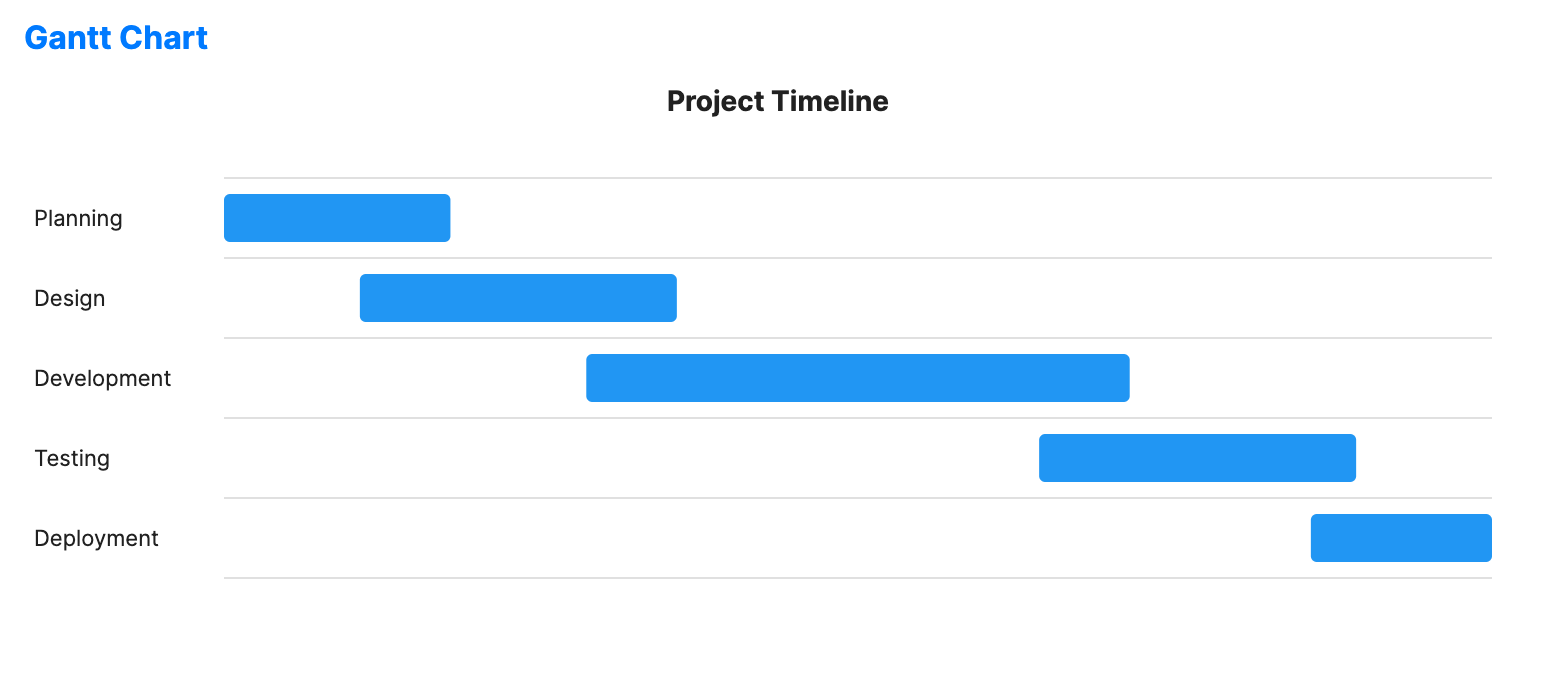
Gantt charts are specialized timeline charts used for project management. They illustrate a project schedule by showing task durations, start/end dates, and dependencies.
When to use
- Project planning: Identifying the critical path and task overlaps.
- Resource management: Tracking when team members are allocated to specific activities.
- Release tracking: Visualizing milestones and deadlines for a software release.
Code example
XAML
<GanttChart xmlns="https://github.com/avaloniaui" Name="GanttChartSample" Title="Project Timeline" Height="300"
                     ItemsSource="{Binding GanttTasks}"
                     TaskNamePath="Name"
                     StartPath="Start"
                     EndPath="End"
                     ProgressPath="Progress"
                     BarHeight="0.72"
                     RowHeight="44"
                     BarBrush="#93C5FD"
                     ProgressBrush="#2563EB" />
Data model (C#)
using System;

public record GanttTask(string Name, DateTime Start, DateTime End, double Progress);

public ObservableCollection<GanttTask> GanttTasks { get; } = new()
{
    new("Planning", DateTime.Today, DateTime.Today.AddDays(5), 100),
    new("Design", DateTime.Today.AddDays(3), DateTime.Today.AddDays(10), 80),
    new("Development", DateTime.Today.AddDays(8), DateTime.Today.AddDays(20), 48),
    new("Testing", DateTime.Today.AddDays(18), DateTime.Today.AddDays(25), 18),
    new("Deployment", DateTime.Today.AddDays(24), DateTime.Today.AddDays(28), 0)
};
Common properties
| Property | Description | Default |
|---|---|---|
ItemsSource | The collection of project tasks. | null |
StartPath | Property name for the task start time. | null |
EndPath | Property name for the task end time. | null |
TaskNamePath | Property name for the task label. | null |
ProgressPath | Property name for the task progress value from 0 to 100. | null |
BarHeight | Height of each task bar as a fraction of row height. | 0.6 |
RowHeight | Height of each task row in pixels. | 40.0 |
BarBrush | Brush used for the task bars. | #2196F3 |
ProgressBrush | Brush used for the progress overlay. | #1565C0 |