Annotations
Charts are available with Avalonia Pro.
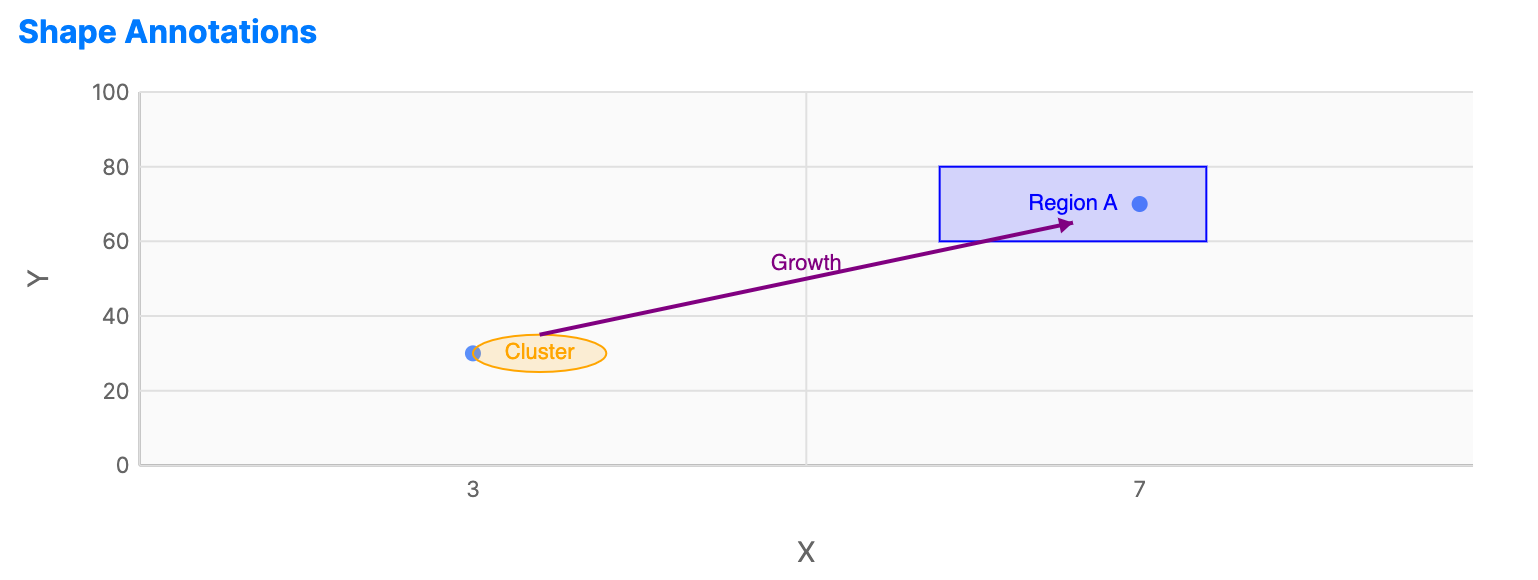
Annotations allow you to add context to your charts using lines, bands, shapes, and custom text. They are useful for highlighting thresholds, milestones, or specific regions of interest.
When to use
- Thresholds: Showing a "target" or "limit" line on a performance chart.
- Milestones: Marking specific dates of interest on a timeline.
- Region highlighting: Shading a "danger zone" or "comfort zone" across a set of values.
Code example
XAML
<CartesianChart xmlns="https://github.com/avaloniaui" Name="ShapesChart" Height="250">
                        <CartesianChart.HorizontalAxis>
                            <NumericalAxis Title="X" Minimum="0" Maximum="10" />
                        </CartesianChart.HorizontalAxis>
                        <CartesianChart.VerticalAxis>
                            <NumericalAxis Title="Y" Minimum="0" Maximum="100" />
                        </CartesianChart.VerticalAxis>
                        <CartesianChart.Series>
                            <ScatterSeries Title="Points" ItemsSource="{Binding ShapeData}"
                                                    CategoryPath="X" ValuePath="Y" MarkerSize="8" />
                        </CartesianChart.Series>
                        <CartesianChart.Annotations>
                            <!-- Highlight Region -->
                            <RectangleAnnotation X="0.6" Y="60" Width="0.2" Height="20"
                                                          Stroke="Blue" Label="Region A">
                                <RectangleAnnotation.Fill>
                                    <SolidColorBrush Color="#280000FF" />
                                </RectangleAnnotation.Fill>
                            </RectangleAnnotation>
                            <!-- Circle of Interest -->
                            <EllipseAnnotation X="0.3" Y="30" RadiusX="0.05" RadiusY="5"
                                                        Stroke="Orange" Label="Cluster">
                                <EllipseAnnotation.Fill>
                                    <SolidColorBrush Color="#28FFA500" />
                                </EllipseAnnotation.Fill>
                            </EllipseAnnotation>
                            <!-- Trend Arrow -->
                            <ArrowLineAnnotation X1="0.3" Y1="35" X2="0.7" Y2="65"
                                                          Stroke="Purple" StrokeThickness="2" ShowEndArrow="True" Label="Growth" />
                        </CartesianChart.Annotations>
                    </CartesianChart>
Data model (C#)
public record Point(double X, double Y);

public ObservableCollection<Point> ShapeData { get; } = new()
{
    new(3, 30),
    new(7, 70)
};
Coordinate system
Annotation coordinates are specified in axis space. On category axes, horizontal values use zero-based category slot indexes. On continuous horizontal axes, horizontal values use the axis value domain, such as numeric values or DateTime ticks. Vertical values use the vertical axis value domain.
Shape sizes are also measured in axis units. On logarithmic axes or axes with scale breaks, the same data delta can map to different pixel sizes depending on its origin. Custom annotation renderers should use CartesianAnnotationRenderContext.DataXToPixel and DataYToPixel for positions, and DeltaXToPixelsAt(origin, value) or DeltaYToPixelsAt(origin, value) for origin-sensitive sizes.
Common properties (LineAnnotation)
| Property | Description | Default |
|---|---|---|
Value | Axis-space value where the line is placed. Horizontal lines use vertical-axis values; vertical lines use horizontal-axis values. | 0 |
Orientation | Horizontal or Vertical. | Horizontal |
Stroke | Color of the annotation line. | Gray |
StrokeThickness | Width of the annotation line. | 1.0 |
DashStyle | Dash style used for the annotation line. | null |
Foreground | Brush used for the label text. When null, the annotation falls back to Stroke where supported. | null |
FontSize | Font size used for annotation labels. | 12.0 |
Label | Text displayed next to the line. | null |
Common properties (BandAnnotation)
| Property | Description | Default |
|---|---|---|
FromValue | Starting axis-space value of the band. Horizontal bands use vertical-axis values; vertical bands use horizontal-axis values. | 0 |
ToValue | Ending axis-space value of the band. | 0 |
Orientation | Horizontal or Vertical. | Horizontal |
Fill | The brush used to fill the shaded area. | null |
Foreground | Brush used for the band label text. When null, the annotation falls back to Stroke where supported. | null |
FontSize | Font size used for the band label. | 12.0 |
Label | Text displayed inside the band. | null |
Common properties (TextAnnotation)
A text annotation placed at a specific coordinate on the chart area.
| Property | Description | Default |
|---|---|---|
X | Horizontal-axis value. Category axes use zero-based category slot indexes. | 0 |
Y | Vertical-axis value. | 0 |
Text | Text displayed by the annotation. | null |
Foreground | Brush used for the text fill. | null |
FontSize | Font size used for the text. | 12.0 |
Stroke | Optional text outline brush. Text outlines are drawn only when Stroke is explicitly set. | Gray |
StrokeThickness | Optional text outline thickness. Applied only when Stroke is explicitly set. | 1.0 |
Opacity | Opacity of the annotation. | 1.0 |
Common properties (RectangleAnnotation)
A rectangle annotation placed at specific coordinates on the chart area.
| Property | Description | Default |
|---|---|---|
X | Left horizontal-axis value. Category axes use zero-based category slot indexes. | 0 |
Y | Lower vertical-axis value. | 0 |
Width | Width in horizontal-axis units. | 0.5 |
Height | Height in vertical-axis units. | 10.0 |
Fill | Brush used to fill the rectangle. | null |
CornerRadius | Corner radius for rounded rectangles. | 0 |
Label | Text displayed at the center of the rectangle. | null |
Stroke | Color of the rectangle border. | Gray |
StrokeThickness | Width of the rectangle border. | 1 |
Foreground | Brush used for the rectangle label text. | null |
FontSize | Font size used for the rectangle label. | 12.0 |
Opacity | Opacity of the annotation. | 1.0 |
XAML
<CartesianChart xmlns="https://github.com/avaloniaui" Height="250">
    <CartesianChart.Annotations>
        <RectangleAnnotation X="0.2" Y="50" Width="0.3" Height="20"
                                    Stroke="DarkGreen" StrokeThickness="2"
                                    CornerRadius="4" Label="Target Zone">
            <RectangleAnnotation.Fill>
                <SolidColorBrush Color="#3200FF00" />
            </RectangleAnnotation.Fill>
        </RectangleAnnotation>
    </CartesianChart.Annotations>
</CartesianChart>
Common properties (EllipseAnnotation)
An ellipse annotation placed at specific coordinates on the chart area.
| Property | Description | Default |
|---|---|---|
X | Center horizontal-axis value. Category axes use zero-based category slot indexes. | 0 |
Y | Center vertical-axis value. | 0 |
RadiusX | Horizontal radius in axis units. | 0.25 |
RadiusY | Vertical radius in axis units. | 10.0 |
Fill | Brush used to fill the ellipse. | null |
Label | Text displayed at the center of the ellipse. | null |
Stroke | Color of the ellipse border. | Gray |
StrokeThickness | Width of the ellipse border. | 1 |
Foreground | Brush used for the ellipse label text. | null |
FontSize | Font size used for the ellipse label. | 12.0 |
Opacity | Opacity of the annotation. | 1.0 |
XAML
<CartesianChart xmlns="https://github.com/avaloniaui" Height="250">
    <CartesianChart.Annotations>
        <EllipseAnnotation X="0.5" Y="60" RadiusX="0.15" RadiusY="15"
                                  Stroke="Purple" StrokeThickness="2"
                                  Label="Anomaly">
            <EllipseAnnotation.Fill>
                <SolidColorBrush Color="#32800080" />
            </EllipseAnnotation.Fill>
        </EllipseAnnotation>
    </CartesianChart.Annotations>
</CartesianChart>
Common properties (ArrowLineAnnotation)
A line annotation with optional arrowheads at either or both ends, useful for indicating direction or drawing attention between two data points.
| Property | Description | Default |
|---|---|---|
X1 | Start horizontal-axis value. Category axes use zero-based category slot indexes. | 0 |
Y1 | Start vertical-axis value. | 0 |
X2 | End horizontal-axis value. | 0 |
Y2 | End vertical-axis value. | 0 |
ShowStartArrow | Whether to show an arrowhead at the start. | false |
ShowEndArrow | Whether to show an arrowhead at the end. | true |
ArrowSize | Size of the arrowhead in pixels. | 8.0 |
Label | Text displayed at the midpoint of the line. | null |
Stroke | Color of the arrow line. | Gray |
StrokeThickness | Width of the arrow line. | 1 |
Foreground | Brush used for the arrow label text. | null |
FontSize | Font size used for the arrow label. | 12.0 |
Opacity | Opacity of the annotation. | 1.0 |
XAML
<CartesianChart xmlns="https://github.com/avaloniaui" Height="250">
    <CartesianChart.Annotations>
        <ArrowLineAnnotation X1="0.1" Y1="30" X2="0.6" Y2="80"
                                    Stroke="OrangeRed" StrokeThickness="2"
                                    ShowEndArrow="True" ArrowSize="10"
                                    Label="Upward trend" />
    </CartesianChart.Annotations>
</CartesianChart>