Trendline chart
Charts are available with Avalonia Pro.
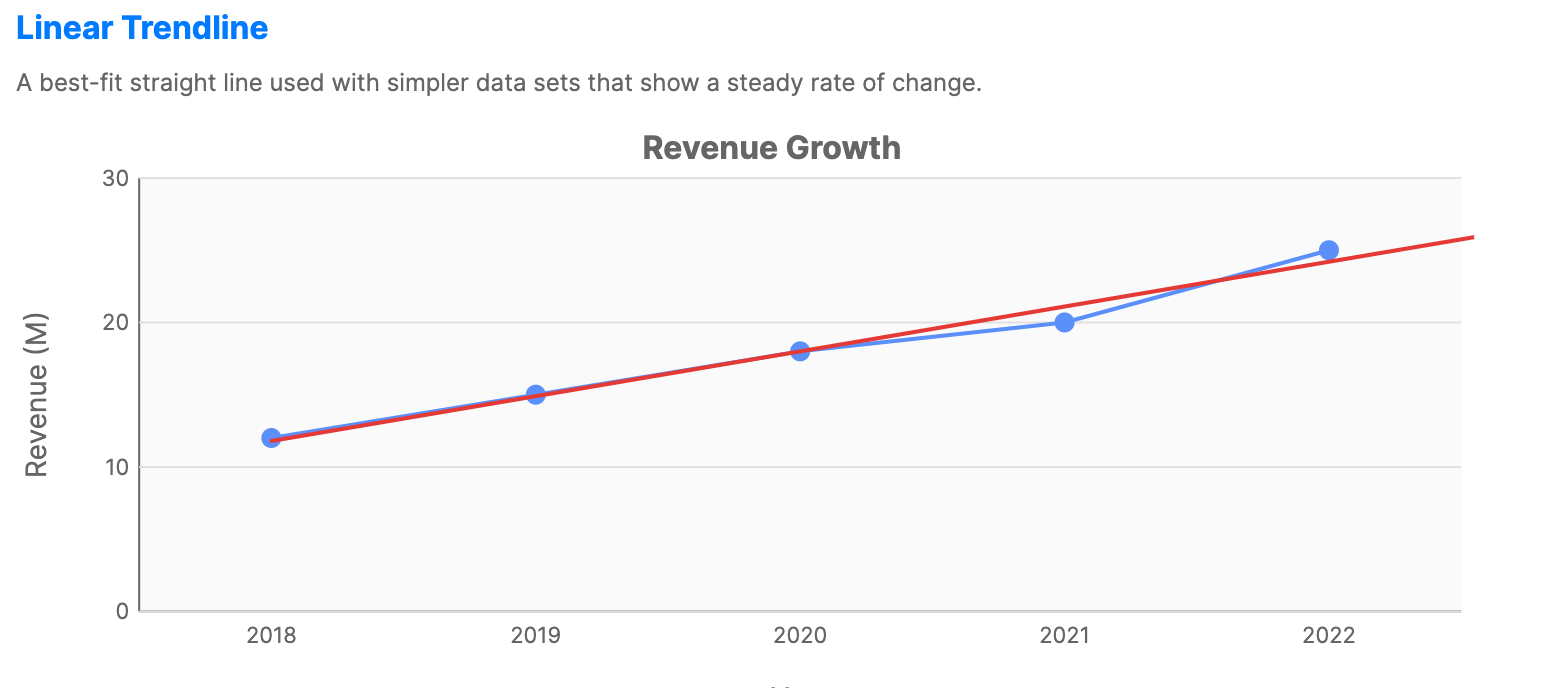
Trendlines are used in Cartesian charts to show the general direction or pattern of data. They filter out noise to highlight underlying trends. They can fit linear, polynomial, power, exponential, logarithmic, or moving average data.
When to use
- Sales forecasting: Projecting future sales based on historical trends.
- Data smoothing: Identifying patterns in volatile stock or sensor data.
- Performance evaluation: Visualizing if throughput is generally increasing or decreasing.
Code example
XAML
<CartesianChart xmlns="https://github.com/avaloniaui" Title="Revenue Growth" Height="300">
    <CartesianChart.HorizontalAxis>
        <CategoryAxis Title="Year" />
    </CartesianChart.HorizontalAxis>
    <CartesianChart.VerticalAxis>
        <NumericalAxis Title="Revenue (M)" Minimum="0" />
    </CartesianChart.VerticalAxis>
    <CartesianChart.Series>
        <LineSeries Title="Revenue"
                           ItemsSource="{Binding LinearData}"
                           CategoryPath="Category"
                           ValuePath="Value"
                           StrokeThickness="2"
                           ShowMarkers="True">
            <LineSeries.Trendlines>
                <Trendline Type="Linear"
                                  Stroke="#E53935"
                                  StrokeThickness="2"
                                  ForwardForecast="1" />
            </LineSeries.Trendlines>
        </LineSeries>
    </CartesianChart.Series>
</CartesianChart>
Data model (C#)
public record ChartDataPoint(string Category, double Value);

public ObservableCollection<ChartDataPoint> LinearData { get; } = new()
{
    new("2018", 12),
    new("2019", 15),
    new("2020", 18),
    new("2021", 20),
    new("2022", 25)
};
Common properties (Trendline)
| Property | Description | Default |
|---|---|---|
Type | Data type the trendline should fit: Linear, Exponential, Logarithmic, Power, Polynomial, or MovingAverage. | Linear |
Stroke | Brush used to draw the trendline. | Gray |
StrokeThickness | Thickness of the trendline stroke. | 2.0 |
StrokeDashStyle | Dash style used for the trendline stroke. | null |
StrokeLineCap | Line cap used at the trendline ends. | Round |
StrokeLineJoin | Line join used where trendline segments meet. | Round |
IsVisible | Whether the trendline is rendered. | true |
ForwardForecast | Number of units to project forward. | 0 |
BackwardForecast | Number of units to project backward. | 0 |
Period | For MovingAverage, the number of points to average. | 2 |
PolynomialOrder | Polynomial degree when Type is Polynomial. | 2 |
ChartTrendlineSeries
ChartTrendlineSeries is a standalone series that renders a trendline overlay using regression calculations. Unlike the Trendline attached property, it is added directly to the chart's Series collection and can reference another series via SourceSeries or use its own ItemsSource.
XAML
<CartesianChart xmlns="https://github.com/avaloniaui" Title="Explicit Overlay Series" Height="320" ShowLegend="True">
    <CartesianChart.HorizontalAxis>
        <CategoryAxis Title="Index" />
    </CartesianChart.HorizontalAxis>
    <CartesianChart.VerticalAxis>
        <NumericalAxis Title="Value" Minimum="0" />
    </CartesianChart.VerticalAxis>

    <CartesianChart.Series>
        <ScatterSeries x:Name="StandaloneTrendlineSource"
                              Title="Observed Data"
                              ItemsSource="{Binding StandaloneTrendlineData}"
                              CategoryPath="Category"
                              ValuePath="Value"
                              Fill="#455A64"
                              MarkerSize="8" />
        <ChartTrendlineSeries Title="Polynomial Overlay"
                                     SourceSeries="{Binding #StandaloneTrendlineSource}"
                                     TrendlineType="Polynomial"
                                     PolynomialOrder="3"
                                     Stroke="#D32F2F"
                                     StrokeThickness="2.5"
                                     Extend="0.15" />
    </CartesianChart.Series>
</CartesianChart>
Data model (C#)
public record ChartDataPoint(string Category, double Value);

public ObservableCollection<ChartDataPoint> StandaloneTrendlineData { get; } = new()
{
    new("1", 16),
    new("2", 20),
    new("3", 27),
    new("4", 29),
    new("5", 38),
    new("6", 43),
    new("7", 47),
    new("8", 56)
};
ChartTrendlineSeries properties
| Property | Description | Default |
|---|---|---|
TrendlineType | The regression type: Linear, Polynomial, Exponential, Logarithmic, Power, or MovingAverage. | Linear |
PolynomialOrder | The polynomial degree when TrendlineType is Polynomial. | 2 |
Period | Number of points used when TrendlineType is MovingAverage. | 2 |
SourceSeries | The series to calculate the trendline from. If null, uses ItemsSource directly. | null |
Extend | How far to extend the trendline beyond the data range, as a fraction (e.g., 0.1 = 10%). | 0 |
MovingAverageSeries
MovingAverageSeries displays a moving average overlay for financial or time-series data. It supports Simple (SMA), Exponential (EMA), Weighted (WMA), and Triangular (TMA) moving average calculations. It can be used in CartesianChart, or in FinancialChart as an overlay that follows the financial chart's date and price coordinates.
XAML
<CartesianChart xmlns="https://github.com/avaloniaui" Title="Price with Moving Average" Height="300">
    <CartesianChart.Series>
        <LineSeries x:Name="PriceSeries"
                             ItemsSource="{Binding PriceData}"
                             CategoryPath="Date"
                             ValuePath="Close" />
        <MovingAverageSeries Title="SMA (14)"
                                      SourceSeries="{Binding #PriceSeries}"
                                      MovingAverageType="Simple"
                                      Period="14"
                                      Stroke="Orange"
                                      StrokeThickness="2" />
    </CartesianChart.Series>
</CartesianChart>
Data model (C#)
using System;

public record PricePoint(DateTime Date, double Close);

public ObservableCollection<PricePoint> PriceData { get; } = new()
{
    new(new DateTime(2026, 1, 1), 100),
    new(new DateTime(2026, 1, 2), 104),
    new(new DateTime(2026, 1, 3), 101),
    new(new DateTime(2026, 1, 4), 108),
    new(new DateTime(2026, 1, 5), 112)
};
MovingAverageSeries properties
| Property | Description | Default |
|---|---|---|
MovingAverageType | The calculation type: Simple, Exponential, Weighted, or Triangular. | Simple |
Period | The number of data points used in the moving average window. | 14 |
SourceSeries | The series to calculate the moving average from. If null, uses ItemsSource directly. | null |