Data labels
info
Charts are available with Avalonia Pro.
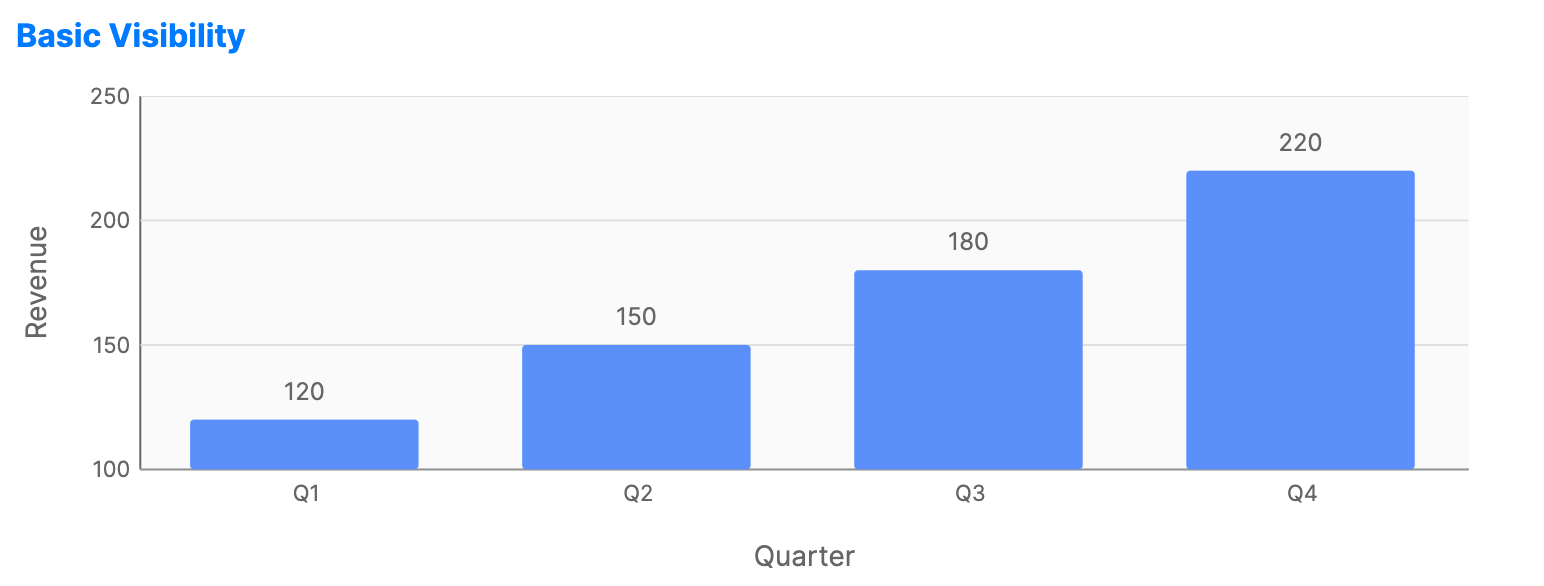
Data labels place the actual values directly on the chart series. This lets readers compare values without estimating them from axis positions.
When to use
- Presentation graphics: Where clear, immediate values are prioritized.
- Small multiples: When axes are omitted to save space.
- Key milestones: Highlighting specific values that require attention.
Code example
XAML
<CartesianChart xmlns="https://github.com/avaloniaui" Name="BasicLabelsChart" Height="250">
                        <CartesianChart.Series>
                            <BarSeries Title="Sales" ItemsSource="{Binding SalesData}"
                                                CategoryPath="Category" ValuePath="Value"
                                                ShowLabels="True" LabelOffset="5"/>
                        </CartesianChart.Series>
                        <CartesianChart.HorizontalAxis>
                            <CategoryAxis Title="Quarter" />
                        </CartesianChart.HorizontalAxis>
                        <CartesianChart.VerticalAxis>
                            <NumericalAxis Title="Revenue" />
                        </CartesianChart.VerticalAxis>
                    </CartesianChart>
Data model (C#)
public record SalesPoint(string Category, double Value);

public ObservableCollection<SalesPoint> SalesData { get; } = new()
{
    new("Q1", 120),
    new("Q2", 150),
    new("Q3", 180),
    new("Q4", 220)
};
Common properties (on Series)
| Property | Description | Default |
|---|---|---|
ShowLabels | Toggles values on the series points. | false |
LabelFormat | String format. {0} is the value and {1} is the category. | "{0:N0}" |
LabelFontSize | Size of the text in pixels. | 12.0 |
LabelForeground | Brush used for the text color. | null |
LabelBackground | Brush used behind the label text. | null |
LabelCornerRadius | Corner radius for the label background. | 4 |
LabelPadding | Padding inside the label background. | 4,2 |
LabelOffset | Distance from the data point to the label. | 10.0 |