Axis customization
Charts are available with Avalonia Pro.
Avalonia Charts lets you customize axis appearance, including label fitting, axis line styling, tick marks, gridline configuration, and multi-axis support.
When to use
- Multiple scales: When displaying two different metrics (e.g., Temperature and Humidity) on the same chart.
- Categorical data: When axes represent discrete groups rather than continuous numbers.
- Time-Series analysis: Customizing date formats and intervals for historical data.
Code example
XAML
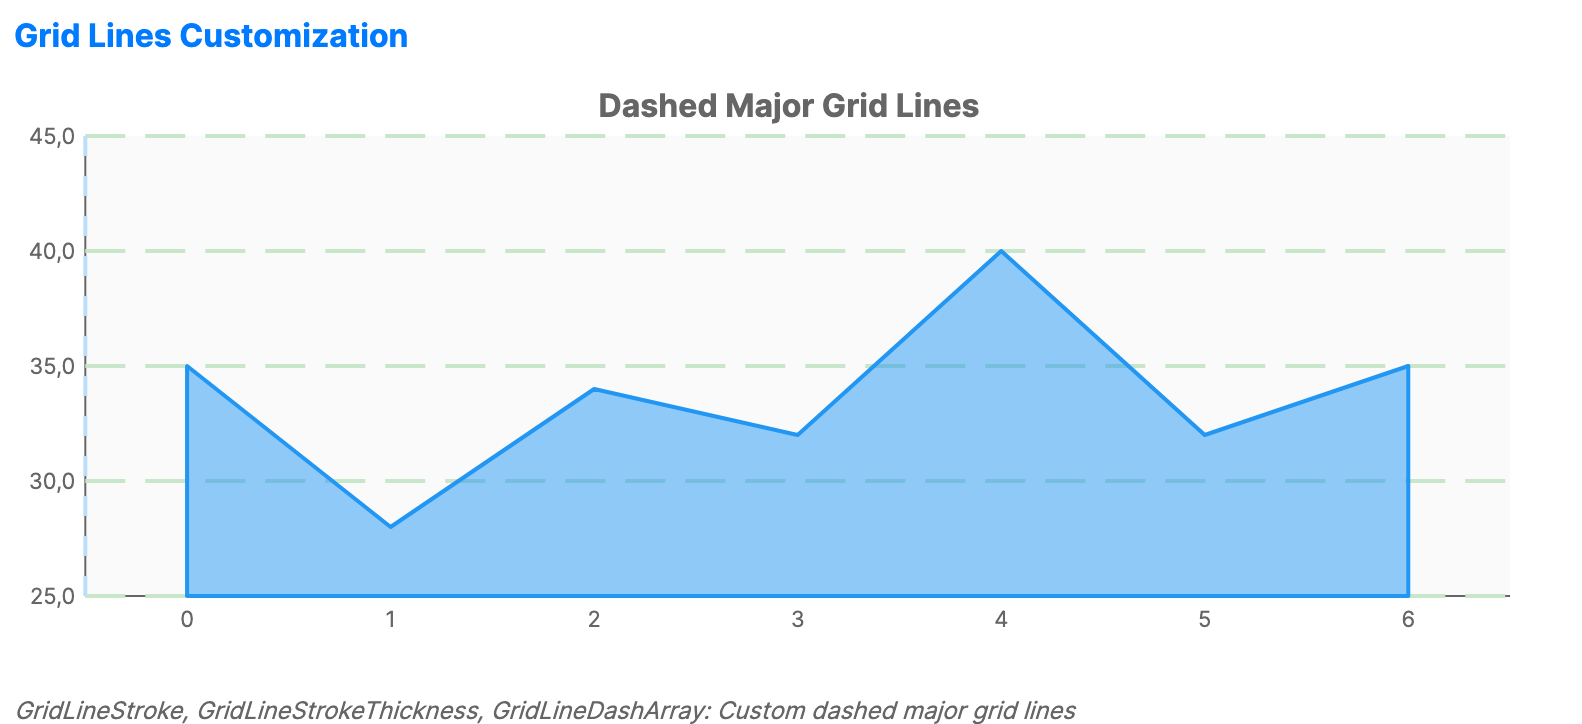
<CartesianChart xmlns="https://github.com/avaloniaui" Name="GridLinesChart" Title="Dashed Major Grid Lines" Height="300">
                        <CartesianChart.HorizontalAxis>
                            <CategoryAxis ShowGridLines="True" GridLineBrush="#BBDEFB" GridLineStrokeThickness="2">
                                <CategoryAxis.GridLineDashStyle>
                                    <DashStyle Dashes="5,5"/>
                                </CategoryAxis.GridLineDashStyle>
                            </CategoryAxis>
                        </CartesianChart.HorizontalAxis>
                        <CartesianChart.VerticalAxis>
                            <NumericalAxis ShowGridLines="True" GridLineBrush="#C8E6C9" GridLineStrokeThickness="2">
                                <NumericalAxis.GridLineDashStyle>
                                    <DashStyle Dashes="10,5"/>
                                </NumericalAxis.GridLineDashStyle>
                            </NumericalAxis>
                        </CartesianChart.VerticalAxis>
                        <CartesianChart.Series>
                            <AreaSeries Title="Data" ItemsSource="{Binding SalesData}" Fill="#7E2196F3" Stroke="#2196F3" />
                        </CartesianChart.Series>
                    </CartesianChart>
Data model (C#)
public ObservableCollection<int> SalesData { get; } = new() { 35, 28, 34, 32, 40, 32, 35 };
Common axis properties (NumericalAxis / CategoryAxis)
| Property | Description | Default |
|---|---|---|
Title | The text label for the axis. | null |
IsVisible | Toggle the visibility of the entire axis. | true |
TitleFontSize | Font size used for the axis title. | 14.0 |
TitleForeground | Brush used for the axis title. | null |
ShowLabels | Whether to draw axis labels. | true |
LabelFontSize | Font size used for axis labels. | 12.0 |
LabelForeground | Brush used for axis labels. | null |
ShowAxisLine | Whether to draw the axis baseline. | true |
AxisLineStroke | Brush used for the axis baseline. When null, the chart axis brush is used. | null |
AxisLineStrokeThickness | Thickness of the axis baseline. | 1.0 |
AxisLineDashStyle | Dash style for the axis baseline. | null |
ShowTickLines | Whether to draw tick marks at label positions. | false |
TickLineLength | Length of tick marks in pixels. | 5.0 |
TickLineStroke | Brush used for tick marks. When null, the chart axis brush is used. | null |
TickLineStrokeThickness | Thickness of tick marks. | 1.0 |
ShowGridLines | Show/hide major grid lines. | true |
ShowMinorGridLines | Show/hide minor grid lines. | false |
GridLineBrush | Brush used for major grid lines. | null |
GridLineStrokeThickness | Thickness of major grid lines. | 1.0 |
GridLineDashStyle | Dash style for major grid lines. | null |
GridLineCap | Line cap style for major grid lines. | Flat |
GridLineJoin | Line join style for major grid lines. | Miter |
MinorGridLineBrush | Brush used for minor grid lines. | null |
MinorGridLineStrokeThickness | Thickness of minor grid lines. | 0.5 |
MinorGridLineDashStyle | Dash style for minor grid lines. | null |
MinorGridLineCap | Line cap style for minor grid lines. | Flat |
MinorGridLineJoin | Line join style for minor grid lines. | Miter |
LabelFormat | Format string for labels (e.g., "C0", "N2", "yyyy"). | null |
LabelRotation | Custom rotation angle used when LabelFitMode is CustomRotation. | 0.0 |
MinorTickCount | Number of minor intervals between major ticks. | 4 |
LabelFitMode | Strategy used when labels do not fit. Values include None, Hide, Wrap, MultipleRows, Rotate45, Rotate90, CustomRotation, and Auto. | None |
Axis types
| Axis | Description | Supports |
|---|---|---|
NumericalAxis | For continuous numeric data. | Minimum, Maximum, MajorStep, MinorStep, ScaleBreaks |
CategoryAxis | For discrete categories. | GapLength, PlotMode |
DateTimeAxis | For date and time data. | Minimum, Maximum, MajorStep, MajorStepUnit, DateFormat |
LogarithmicAxis | For data with a large range. | Minimum, Maximum, LogBase, MajorStep |
Scale breaks
Use NumericalAxis.ScaleBreaks for inline XAML scale breaks or ScaleBreaksSource to bind a collection from a view model. Scale breaks skip ranges that would otherwise compress the visible data. Each ScaleBreak defines a removed value range and optional break-line styling. Invalid ranges where End <= Start are ignored, and overlapping or adjacent breaks are merged before the axis range is normalized.
| Property | Description | Default |
|---|---|---|
Start | First value in the skipped axis range. | 0.0 |
End | Last value in the skipped axis range. | 0.0 |
Stroke | Brush used to draw the scale break marks. | null |
StrokeThickness | Thickness of the scale break marks. | 1.0 |
Axis-specific properties
| Axis | Property | Description | Default |
|---|---|---|---|
NumericalAxis | Minimum | Explicit minimum value. When null, the chart calculates it from data. | null |
NumericalAxis | Maximum | Explicit maximum value. When null, the chart calculates it from data. | null |
NumericalAxis | MajorStep | Major tick interval. Invalid or non-positive values fall back to an automatic step. | null |
NumericalAxis | MinorStep | Minor tick interval. | null |
NumericalAxis | ScaleBreaks | Inline collection of scale breaks. | Empty collection |
NumericalAxis | ScaleBreaksSource | Bound collection used instead of ScaleBreaks when set. | null |
DateTimeAxis | Minimum | Explicit minimum date. When null, the chart calculates it from data. | null |
DateTimeAxis | Maximum | Explicit maximum date. When null, the chart calculates it from data. | null |
DateTimeAxis | MajorStep | Major tick interval combined with MajorStepUnit. Month and year steps are rounded to whole units. | 1.0 |
DateTimeAxis | MajorStepUnit | Unit used by MajorStep: Second, Minute, Hour, Day, Week, Month, or Year. | Day |
DateTimeAxis | DateFormat | Optional date label format string. | null |
LogarithmicAxis | Minimum | Explicit positive minimum value. When null, the chart calculates it from data. | null |
LogarithmicAxis | Maximum | Explicit positive maximum value. When null, the chart calculates it from data. | null |
LogarithmicAxis | LogBase | Logarithm base used for the axis scale. | 10.0 |
LogarithmicAxis | MajorStep | Major tick multiplier. When null, the axis calculates it from LogBase. | null |
Continuous horizontal axes
CartesianChart can render supported series against a continuous horizontal NumericalAxis, LogarithmicAxis, or DateTimeAxis. The chart uses continuous horizontal layout only when every visible non-empty series supports it and each horizontal category value can be converted to the selected axis type.
Supported Cartesian series include LineSeries, SplineSeries, StepLineSeries, AreaSeries, SplineAreaSeries, AreaRangeSeries, ScatterSeries, ScatterLineSeries, BubbleSeries, and ErrorBarSeries. ChartTrendlineSeries and MovingAverageSeries follow the compatibility of their SourceSeries when one is set.
For DateTimeAxis, CategoryPath values must resolve to DateTime or DateTimeOffset. For NumericalAxis and LogarithmicAxis, values must resolve to finite numeric values. LogarithmicAxis requires values greater than 0.
If any visible non-empty series is incompatible, the chart uses category layout for the horizontal axis.
Plot bands
Use ChartAxis.PlotBands to shade ranges on a horizontal or vertical axis. On a category axis, horizontal-axis plot band Start and End values use category indexes. On a continuous horizontal axis, they use the axis value domain.
| Property | Description | Default |
|---|---|---|
Start | Start value of the shaded range. When NaN, the band starts at the beginning of the axis. | NaN |
End | End value of the shaded range. When NaN, the band ends at the end of the axis. | NaN |
Fill | Brush used to fill the band. | null |
Stroke | Brush used for the band border. | null |
StrokeThickness | Thickness of the band border. | 0.0 |
Opacity | Opacity applied to the band fill. | 0.3 |
Text | Optional text drawn inside the band. | null |
Foreground | Brush used for plot band text. | null |
TextFontSize | Font size used for plot band text. | 12.0 |
HorizontalTextAlignment | Horizontal text alignment within the band: Start, Center, or End. | Center |
VerticalTextAlignment | Vertical text alignment within the band: Start, Center, or End. | Center |
IsVisible | Whether the plot band is rendered. | true |
IsRepeating | Whether the band repeats at regular axis intervals. | false |
RepeatEvery | Axis interval between repeated bands. When repeating is enabled with an invalid value, it is set to 1.0. | NaN |
RepeatUntil | Axis value where repeated bands stop. | NaN |
RenderAboveSeries | Whether to render the band above the chart series instead of behind them. | false |