Line chart
info
Charts are available with Avalonia Pro.
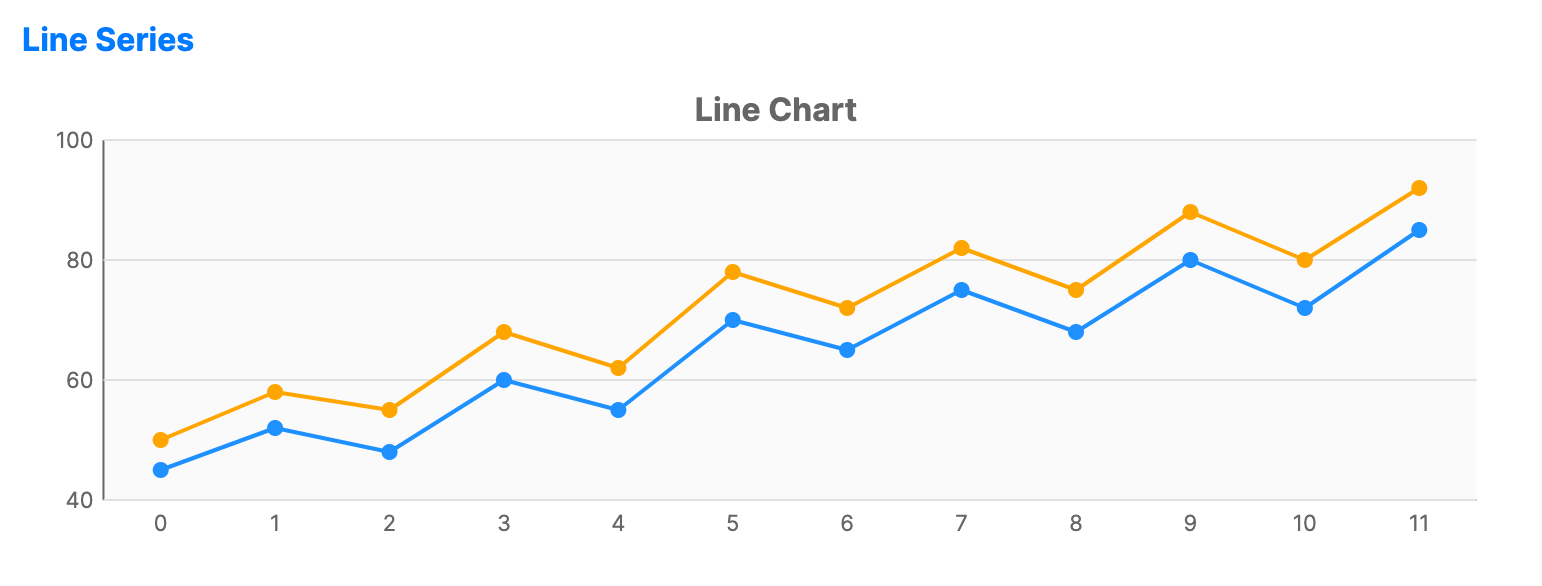
Line charts use X and Y axes to visualize data points connected by straight line segments. They are ideal for showing trends over time or categories.
When to use
- Time series: Visualizing changes in data over continuous time intervals.
- Trend analysis: Identifying upward, downward, or fluctuating patterns.
- Multiple series: Comparing trends across different categories using multiple lines.
Code example
XAML
<CartesianChart xmlns="https://github.com/avaloniaui" Name="LineChart" Title="Line Chart" Height="250" ShowLegend="True">
                        <CartesianChart.HorizontalAxis>
                            <CategoryAxis />
                        </CartesianChart.HorizontalAxis>
                        <CartesianChart.VerticalAxis>
                            <NumericalAxis />
                        </CartesianChart.VerticalAxis>
                        <CartesianChart.Series>
                            <LineSeries Title="2023" ItemsSource="{Binding LineSeries2023}" Stroke="DodgerBlue" StrokeThickness="2" MarkerSize="6" MarkerFill="DodgerBlue"  ShowMarkers="True"/>
                            <LineSeries Title="2024" ItemsSource="{Binding LineSeries2024}" Stroke="Orange" StrokeThickness="2" MarkerSize="6" MarkerFill="Orange"  ShowMarkers="True"/>
                        </CartesianChart.Series>
                    </CartesianChart>
Data model (C#)
public ObservableCollection<int> LineSeries2023 { get; } = new()
{
    45, 52, 48, 60, 55, 70, 65, 75, 68, 80, 72, 85
};

public ObservableCollection<int> LineSeries2024 { get; } = new()
{
    50, 58, 55, 68, 62, 78, 72, 82, 75, 88, 80, 92
};
Common properties
| Property | Description | Default |
|---|---|---|
Title | The name of the series shown in the legend. | null |
ItemsSource | The collection of data items to display. | null |
CategoryPath | Path to the property used for the X-axis (category). | null |
ValuePath | Path to the property used for the Y-axis (value). | null |
Stroke | The color of the line. | Theme-dependent |
StrokeThickness | The thickness of the line. | 2 |
ShowMarkers | Whether to display individual data point markers. Marker styling is visible only when this is true. | false |
MarkerSize | The size of the markers in pixels. | 8 |
MarkerShape | The shape of the markers, such as Circle or Square. | Circle |
MarkerFill | Brush used to fill the markers. When null, the series stroke is used. | null |
MarkerStroke | Brush used for the marker outlines. | null |
MarkerStrokeThickness | Thickness of the marker outlines. When NaN, the series StrokeThickness is used. | NaN |