Area range chart
info
Charts are available with Avalonia Pro.
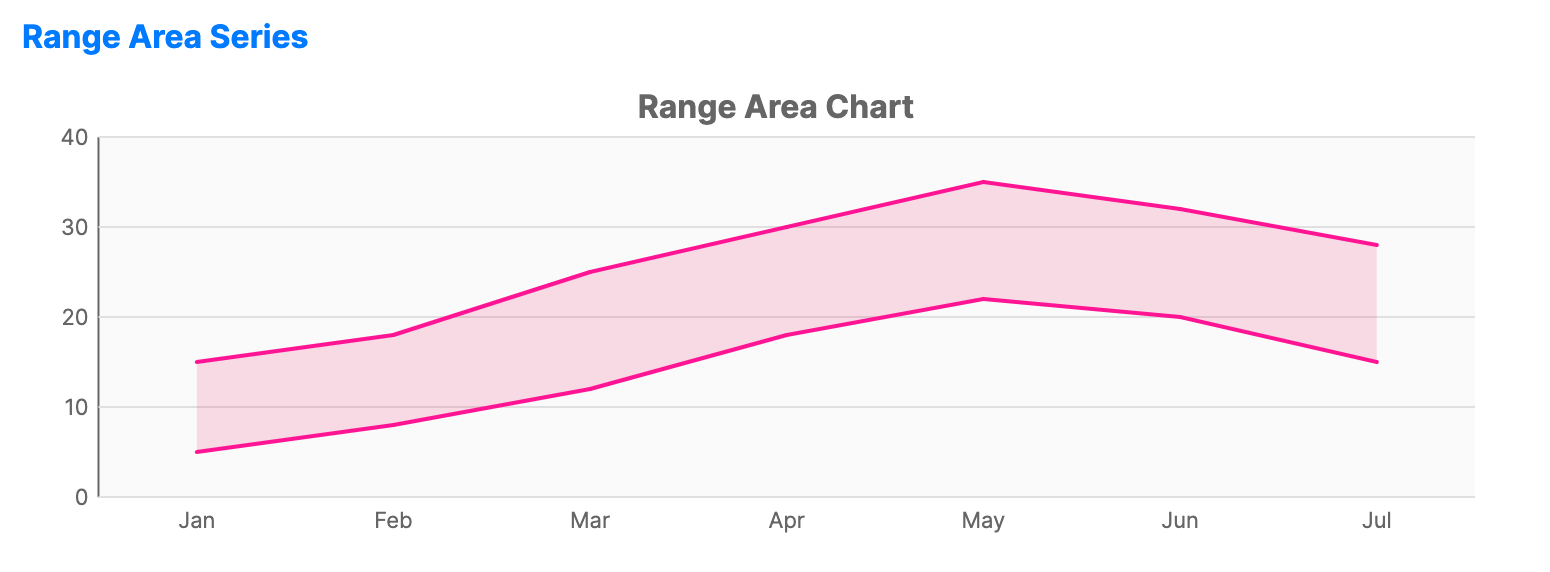
Area range charts display a filled area connecting two values, high and low, for each category. They can be used for visualizing uncertainty, price envelopes, temperature variations, and similar ranges.
When to use
- Error margins: Showing the confidence interval or error range around a mean value.
- Price envelopes: Visualizing daily highs and lows in a single series.
- Temperature ranges: Showing the minimum and maximum temperature over a period.
Code example
XAML
<CartesianChart xmlns="https://github.com/avaloniaui" Name="RangeAreaChart" Title="Range Area Chart" Height="250">
    <CartesianChart.HorizontalAxis>
        <CategoryAxis />
    </CartesianChart.HorizontalAxis>
    <CartesianChart.VerticalAxis>
        <NumericalAxis />
    </CartesianChart.VerticalAxis>
    <CartesianChart.Series>
        <AreaRangeSeries Title="Temperature Range"
                                ItemsSource="{Binding RangeAreaData}"
                                LowPath="Low"
                                HighPath="High"
                                CategoryPath="Category"
                                Fill="#7EE91E63"
                                Stroke="DeepPink"
                                StrokeThickness="2" />
    </CartesianChart.Series>
</CartesianChart>
Data model (C#)
public record CategoryRangePoint(string Category, double Low, double High);

public ObservableCollection<CategoryRangePoint> RangeAreaData { get; } = new()
{
    new("Jan", 5, 15),
    new("Feb", 8, 18),
    new("Mar", 12, 25),
    new("Apr", 18, 30),
    new("May", 22, 35),
    new("Jun", 20, 32),
    new("Jul", 15, 28)
};
Common properties
| Property | Description | Default |
|---|---|---|
Title | The name of the series. | null |
ItemsSource | The collection of range data points. | null |
CategoryPath | Path to the category property on the X-axis. | null |
HighPath | Path to the maximum value property. | null |
LowPath | Path to the minimum value property. | null |
Fill | Brush used to fill the area between points. | Theme-dependent |
Stroke | Brush used for the boundary lines. | Theme-dependent |
ShowLines | Whether to render the upper and lower boundary lines. | true |
FillOpacity | Opacity of the filled band between high and low values. | 0.5 |