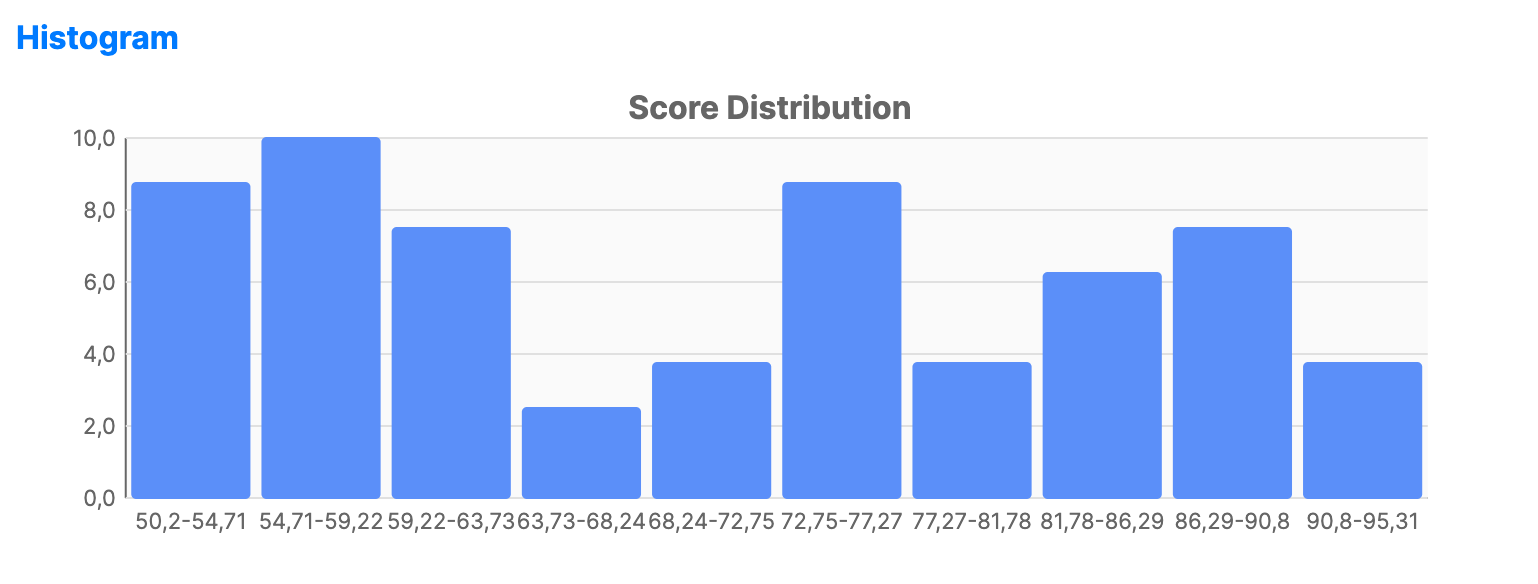
Histogram chart
info
Charts are available with Avalonia Pro.
Histograms group continuous data into "bins" and show the frequency of data points within each bin. They are essential for understanding the distribution of a single variable.
When to use
- Age distribution: Visualizing how many users fall into specific age ranges.
- Performance logs: Analyzing the frequency of response times in a system.
- Quality assurance: Evaluating the spread of product dimensions or weights.
Code example
XAML
<CartesianChart xmlns="https://github.com/avaloniaui" Name="HistogramSample" Title="Score Distribution" Height="250">
                        <CartesianChart.HorizontalAxis><CategoryAxis /></CartesianChart.HorizontalAxis>
                        <CartesianChart.VerticalAxis><NumericalAxis /></CartesianChart.VerticalAxis>
                        <CartesianChart.Series>
                            <HistogramSeries ItemsSource="{Binding HistogramData}" ValuePath="Score" BinCount="10" />
                        </CartesianChart.Series>
                    </CartesianChart>
Data model (C#)
using System;
using System.Linq;

public record HistogramItem(double Score);

public ObservableCollection<HistogramItem> HistogramData { get; } = CreateScores();

private static ObservableCollection<HistogramItem> CreateScores()
{
    var random = new Random(42);

    return new ObservableCollection<HistogramItem>(
        Enumerable.Range(0, 50)
            .Select(_ => new HistogramItem(50 + random.NextDouble() * 50)));
}
Common properties
| Property | Description | Default |
|---|---|---|
ItemsSource | The collection of raw data points. | null |
ValuePath | Path to the numeric property to bin. | null |
BinCount | The number of bars (ranges) to create. | 10 |
BinWidth | (Optional) Explicit width for each range; overrides BinCount when set. | null |
Fill | Brush used for the frequency bars. | Theme-dependent |
BarWidth | Width of each histogram bar as a fraction of the bin width. | 0.9 |
BarCornerRadius | Corner radius for histogram bars. | CornerRadius(2,2,0,0) |