Spline chart
info
Charts are available with Avalonia Pro.
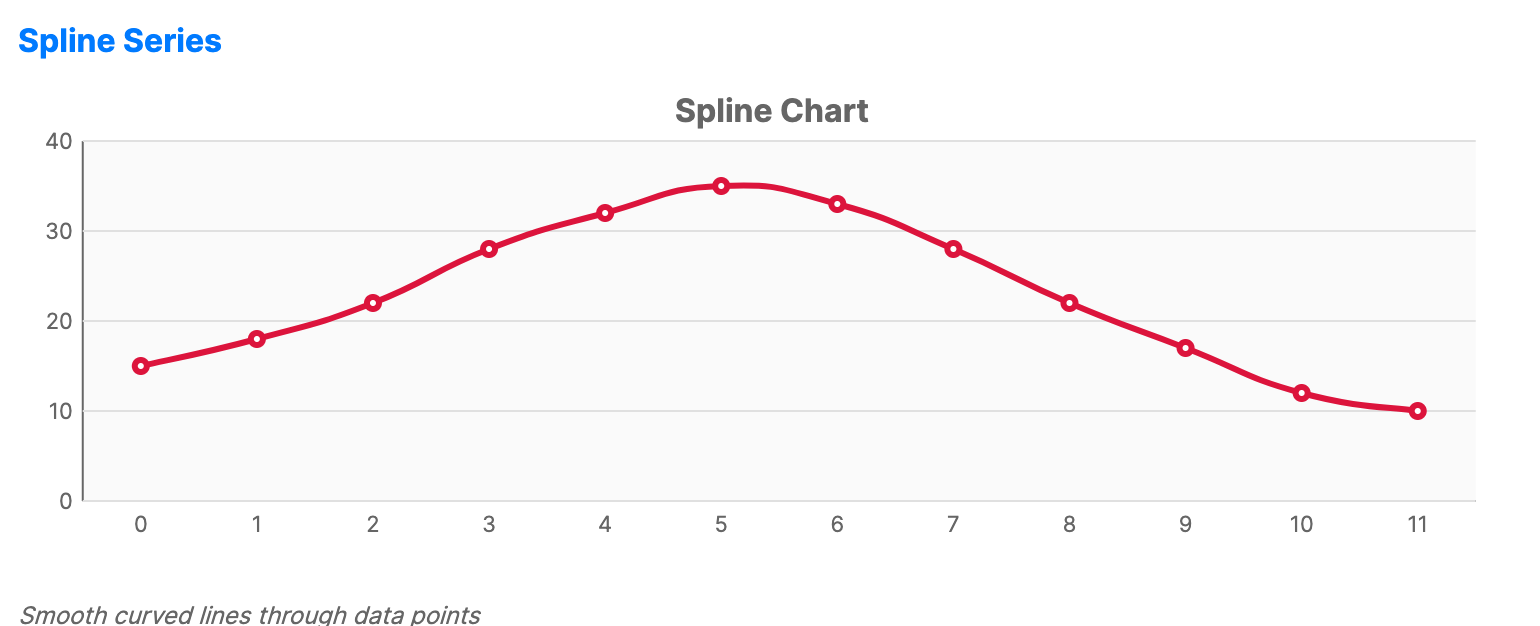
Spline charts are similar to line charts but use smooth polynomial curves to connect data points, providing a more "organic" feel to data trends.
When to use
- Smooth data: When visualizing data that changes continuously and smoothly (e.g., temperature).
- Aesthetics: When a professional, rounded look is preferred over sharp angles.
- Trend smoothing: Helping to visualize the general trend without the harshness of linear segments.
Code example
XAML
<CartesianChart xmlns="https://github.com/avaloniaui" Name="SplineChart" Title="Spline Chart" Height="250">
                        <CartesianChart.HorizontalAxis>
                            <CategoryAxis />
                        </CartesianChart.HorizontalAxis>
                        <CartesianChart.VerticalAxis>
                            <NumericalAxis />
                        </CartesianChart.VerticalAxis>
                        <CartesianChart.Series>
                            <SplineSeries Title="Temperature" ItemsSource="{Binding SplineSeriesData}" Stroke="Crimson" StrokeThickness="3" MarkerSize="6" MarkerFill="White"  ShowMarkers="True"/>
                        </CartesianChart.Series>
                    </CartesianChart>
Data model (C#)
public ObservableCollection<int> SplineSeriesData { get; } = new()
{
    15, 18, 22, 28, 32, 35, 33, 28, 22, 17, 12, 10
};
Common properties
| Property | Description | Default |
|---|---|---|
Title | The name of the series. | null |
ItemsSource | The collection of data items. | null |
Stroke | Color of the spline curve. | Theme-dependent |
StrokeThickness | Width of the curve. | 2 |
ShowMarkers | Whether to display markers at data points. Marker styling is visible only when this is true. | false |
MarkerSize | The size of the markers in pixels. | 6 |
MarkerShape | The shape of the markers, such as Circle or Square. | Circle |
MarkerFill | Brush used to fill the markers. | null |
MarkerStroke | Brush used for the marker outlines. | null |
MarkerStrokeThickness | Thickness of the marker outlines. When NaN, the series StrokeThickness is used. | NaN |
SplineTension | Controls smoothness of the curve. | 0.25 |