Circular gauge chart
info
Charts are available with Avalonia Pro.
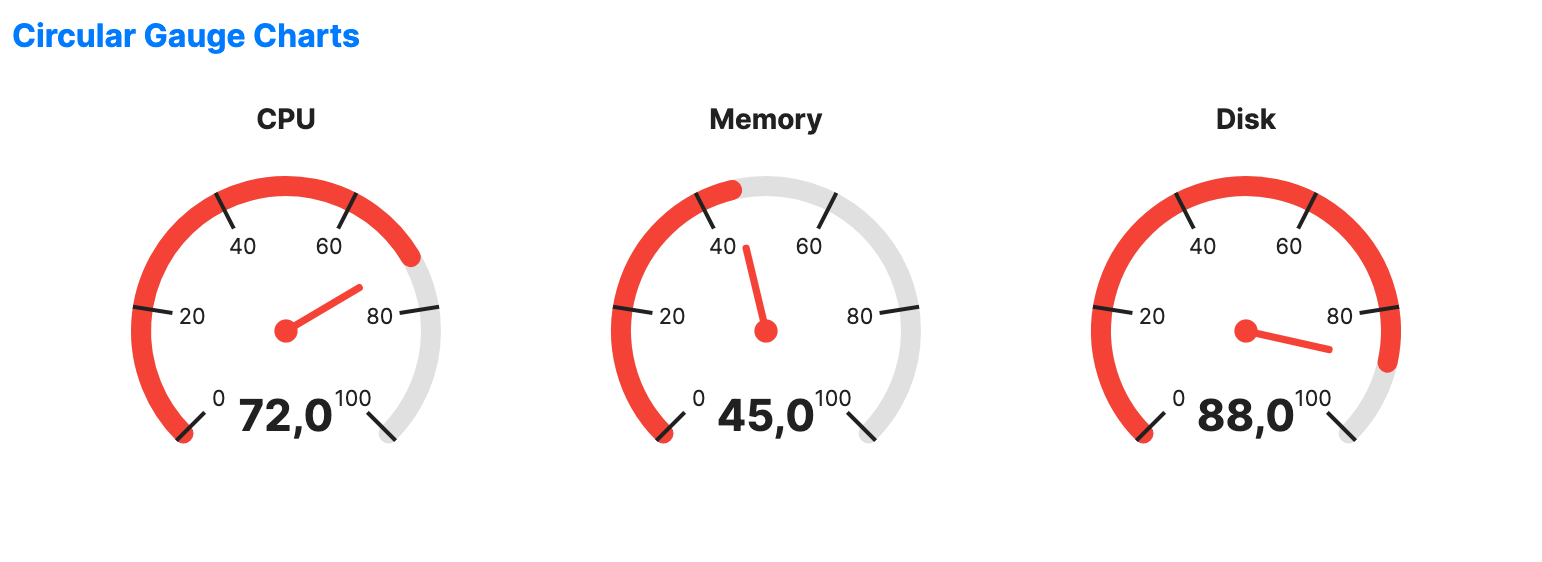
Circular gauge charts visualize a single value on a radial scale. They are the standard for high-level dashboard metrics where a "speedometer" style visual is intuitive.
When to use
- Real-time monitoring: Showing CPU, memory, or network usage.
- Goal tracking: Visualizing progress toward a target (e.g., sales quota).
- Physical simulation: Representing values from physical sensors like speed or pressure.
Code example
XAML
<WrapPanel Orientation="Horizontal" HorizontalAlignment="Center">
    <CircularGaugeChart xmlns="https://github.com/avaloniaui" Value="72" Width="220" Height="220" Title="CPU" Margin="10" />
    <CircularGaugeChart Value="45" Width="220" Height="220" Title="Memory" Margin="10" />
    <CircularGaugeChart Value="88" Width="220" Height="220" Title="Disk" Margin="10" />
</WrapPanel>
Common properties
| Property | Description | Default |
|---|---|---|
Value | The current value to display. | 0.0 |
MinValue | Minimum value of the scale. | 0.0 |
MaxValue | Maximum value of the scale. | 100.0 |
ShowValue | Whether to display the numeric value. | true |
ValueFormat | Format string for the displayed value. | "{0:F0}" |
StartAngle | The starting angle of the gauge arc, in degrees. | 135.0 |
SweepAngle | The sweep angle of the gauge arc, in degrees. | 270.0 |
TrackBrush | Brush used for the gauge track. | null |
ValueBrush | Brush used for the filled value arc. | null |
NeedleBrush | Brush used for the needle. | null |
TrackThickness | Thickness of the track arc. | 10.0 |
MajorTickCount | The number of major tick marks. | 5 |