Liquid fill gauge
info
Charts are available with Avalonia Pro.
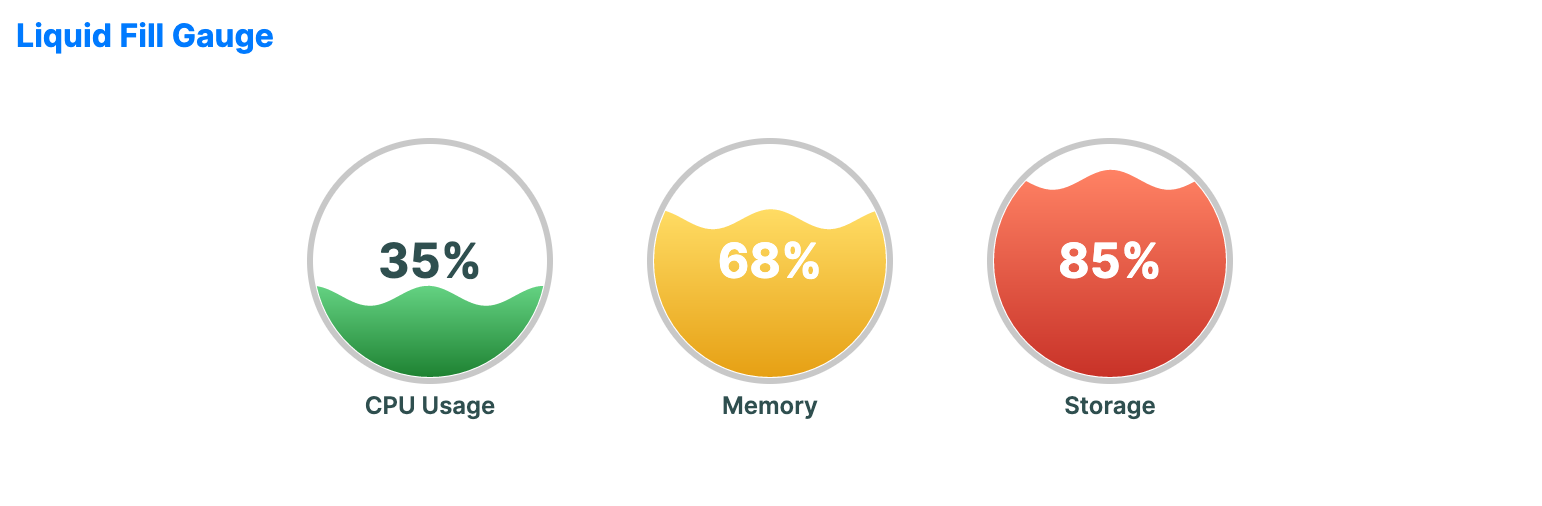
Liquid fill gauges are decorative circular gauges that represent a percentage as 'liquid' at a certain level. They are popular for visualizing tank levels, water usage, or thematic progress.
When to use
- Thematic dashboards: Visualizing "filling" concepts like fundraising or capacity.
- Environmental apps: Showing water levels or liquid container status.
- Engaging UI: Adding a playful, animated metric indicator to a modern application.
Code example
XAML
<WrapPanel Orientation="Horizontal" HorizontalAlignment="Center">
    <LiquidFillGauge xmlns="https://github.com/avaloniaui" Value="35" Width="140" Height="180" Title="CPU Usage" Margin="15" />
    <LiquidFillGauge Value="68" Width="140" Height="180" Title="Memory" Margin="15" />
    <LiquidFillGauge Value="85" Width="140" Height="180" Title="Storage" Margin="15" />
</WrapPanel>
Common properties
| Property | Description | Default |
|---|---|---|
Value | The current value. | 50.0 |
MinValue | The minimum value. | 0.0 |
MaxValue | The maximum value. | 100.0 |
ValueBrush | Brush for the liquid value region. | Gradient / Theme-dependent |
TrackBrush | Brush for the empty background region. | null |
WaveAmplitude | Amplitude of the wave effect. | 5.0 |
WaveFrequency | Frequency of the wave effect. | 2.0 |
ShowPercentage | Whether to display the percentage text. | true |
IsWaveAnimationEnabled | Whether to animate the wave. | true |