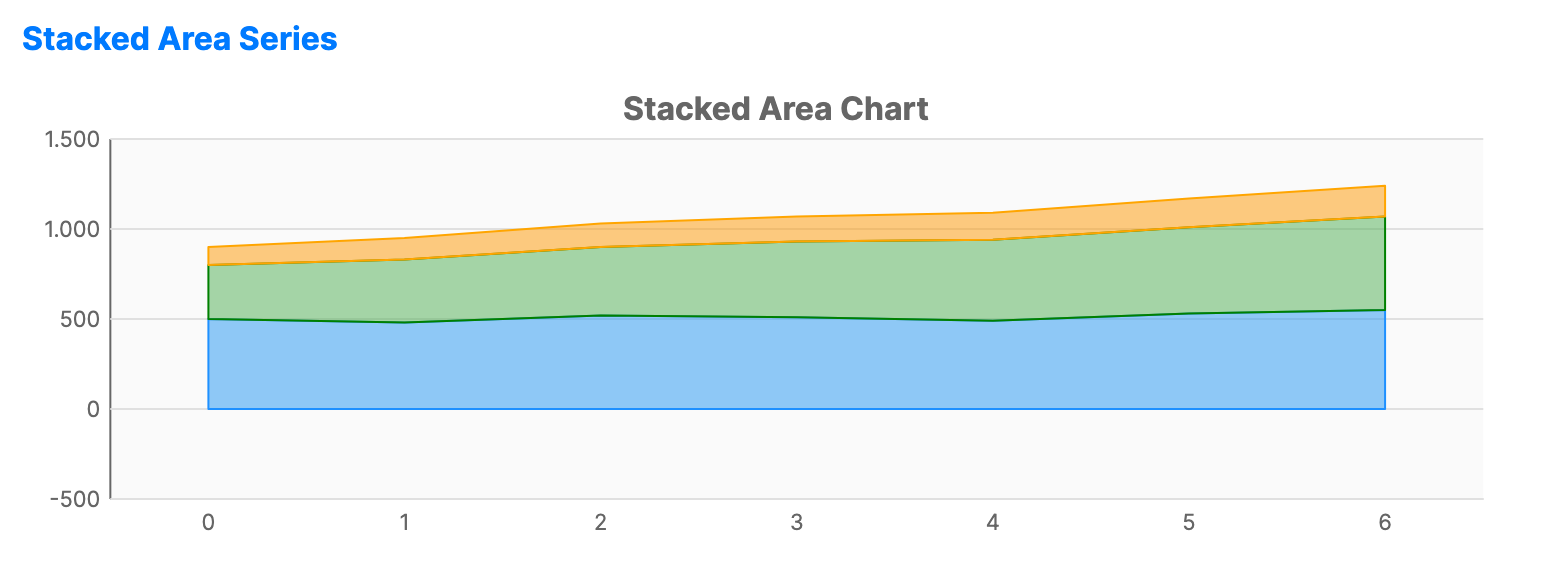
Stacked area chart
info
Charts are available with Avalonia Pro.
Stacked area charts display multiple area series stacked on top of each other. They are ideal for showing how several variables contribute to a total over time.
When to use
- Accumulation: Visualizing the sum of multiple categories over a period.
- Temporal composition: Showing how the makeup of a total value changes chronologically.
- Trend comparison: Comparing the relative growth of different layers.
Code example
XAML
<CartesianChart xmlns="https://github.com/avaloniaui" Name="StackedAreaChart" Title="Stacked Area Chart" Height="250" ShowLegend="True">
    <CartesianChart.HorizontalAxis>
        <CategoryAxis />
    </CartesianChart.HorizontalAxis>
    <CartesianChart.VerticalAxis>
        <NumericalAxis />
    </CartesianChart.VerticalAxis>
    <CartesianChart.Series>
        <StackedAreaSeries Title="Desktop"
                                  ItemsSource="{Binding StackedAreaDesktop}"
                                  Fill="#7E2196F3"
                                  Stroke="DodgerBlue" />
        <StackedAreaSeries Title="Mobile"
                                  ItemsSource="{Binding StackedAreaMobile}"
                                  Fill="#7E4CAF50"
                                  Stroke="Green" />
        <StackedAreaSeries Title="Tablet"
                                  ItemsSource="{Binding StackedAreaTablet}"
                                  Fill="#7EFF9800"
                                  Stroke="Orange" />
    </CartesianChart.Series>
</CartesianChart>
Data model (C#)
public ObservableCollection<int> StackedAreaDesktop { get; } =
    new() { 500, 480, 520, 510, 490, 530, 550 };

public ObservableCollection<int> StackedAreaMobile { get; } =
    new() { 300, 350, 380, 420, 450, 480, 520 };

public ObservableCollection<int> StackedAreaTablet { get; } =
    new() { 100, 120, 130, 140, 150, 160, 170 };
Common properties (StackedAreaSeries)
| Property | Description | Default |
|---|---|---|
Title | The series name. | null |
ItemsSource | The data collection for this layer. | null |
Fill | Brush used for this specific area layer. | Auto-generated |
FillOpacity | Transparency level (0.0 to 1.0). | 0.7 |
StackGroup | Stack identifier. Series with the same value are stacked together. | "default" |