Event timeline chart
info
Charts are available with Avalonia Pro.
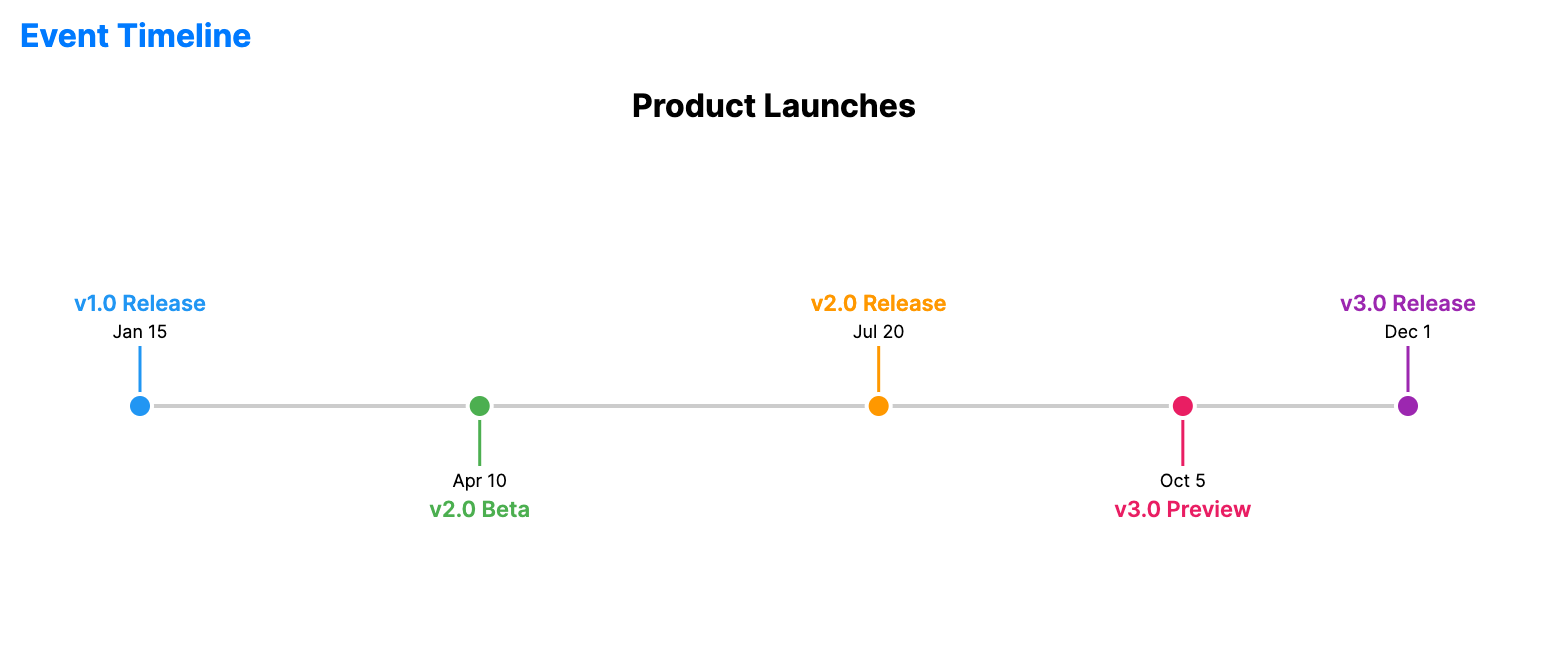
Event timeline charts visualize a series of events chronologically. They provide a clear representation of historical or planned occurrences along a fixed time axis.
When to use
- Historical records: Visualizing milestones, product launches, or life events.
- Audit trails: Showing system logs or user activities in sequence.
- Vertical timelines: Ideal for mobile-friendly or column-based layouts.
Code example
XAML
<EventTimelineChart xmlns="https://github.com/avaloniaui" Name="EventTimelineSample"
                                                 Title="Product Launches"
                                                 Height="300"
                                                 ItemsSource="{Binding TimelineEvents}"
                                                 DatePath="Date"
                                                 LabelPath="Event" />
Data model (C#)
using System;

public record TimelineEvent(DateTime Date, string Event);

public ObservableCollection<TimelineEvent> TimelineEvents { get; } = new()
{
    new(new DateTime(2024, 1, 15), "v1.0 Release"),
    new(new DateTime(2024, 4, 10), "v2.0 Beta"),
    new(new DateTime(2024, 7, 20), "v2.0 Release"),
    new(new DateTime(2024, 10, 5), "v3.0 Preview"),
    new(new DateTime(2024, 12, 1), "v3.0 Release")
};
Common properties
| Property | Description | Default |
|---|---|---|
ItemsSource | The collection of events. | null |
DatePath | Path to the DateTime property. | null |
LabelPath | Path to the event description. | null |
DescriptionPath | Optional path to longer supporting text. | null |
BrushPath | Optional path to a brush or color value for each item. | null |
MarkerSize | Size of the event markers. | 12.0 |
StrokeThickness | Thickness of the main timeline. | 2.0 |
Orientation | Orientation of the chart, Horizontal or Vertical. | Horizontal |