Spiral timeline
info
Charts are available with Avalonia Pro.
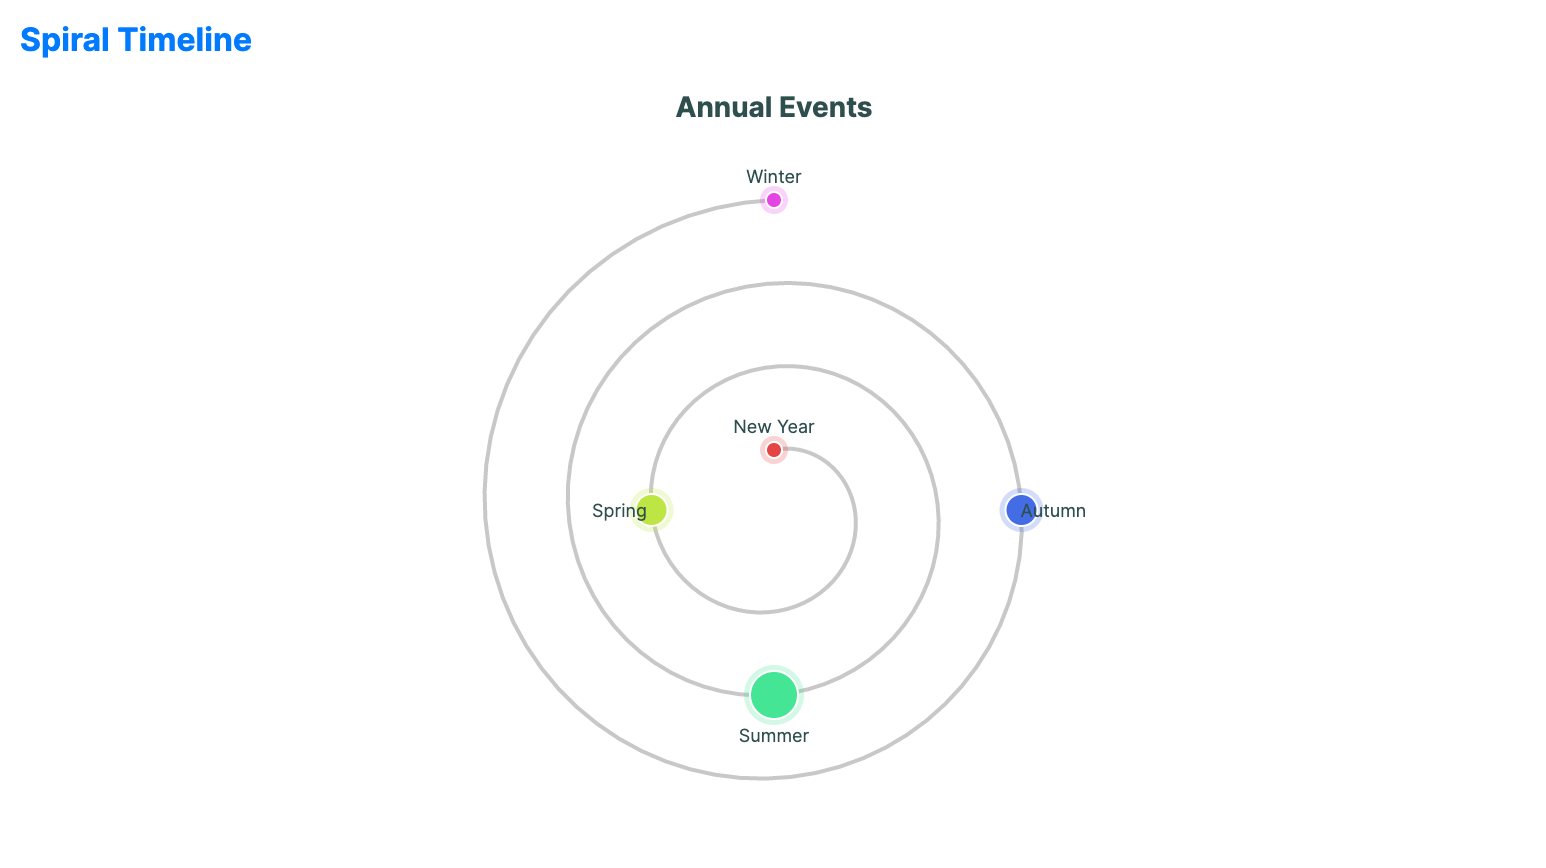
Spiral timelines visualize data that has both a strong sequential component and a cyclical pattern. By wrapping the timeline into a spiral, long-term trends and short-term repetitions become visible.
When to use
- Long-term cyclical data: Visualizing annual climate changes over several decades.
- System logs: Detecting patterns in server activity across weeks or months.
- Biological rhythms: Showing sleep patterns or activity cycles over time.
Code example
XAML
<SpiralTimeline xmlns="https://github.com/avaloniaui" Name="SpiralTimelineSample"
                                             Title="Annual Events"
                                             Height="400"
                                             ItemsSource="{Binding SpiralEvents}"
                                             ValuePath="Value"
                                             LabelPath="Event" />
Data model (C#)
using System;

public record SpiralEvent(DateTime Date, string Event, double Value);

public ObservableCollection<SpiralEvent> SpiralEvents { get; } = new()
{
    new(new DateTime(2024, 1, 1), "New Year", 1.0),
    new(new DateTime(2024, 3, 20), "Spring", 2.0),
    new(new DateTime(2024, 6, 21), "Summer", 3.0),
    new(new DateTime(2024, 9, 22), "Autumn", 2.0),
    new(new DateTime(2024, 12, 21), "Winter", 1.0)
};
Common properties
| Property | Description | Default |
|---|---|---|
ItemsSource | The collection of points on the spiral. | null |
DatePath | Path to the chronological property. | null |
ValuePath | Numerical property determining point size/color. | null |
LabelPath | Path to the text label for each point. | null |
Turns | Number of turns in the spiral. | 3.0 |
InnerRadius | Inner radius of the spiral. | 30.0 |
MarkerSize | Size of the data point markers. | 8.0 |