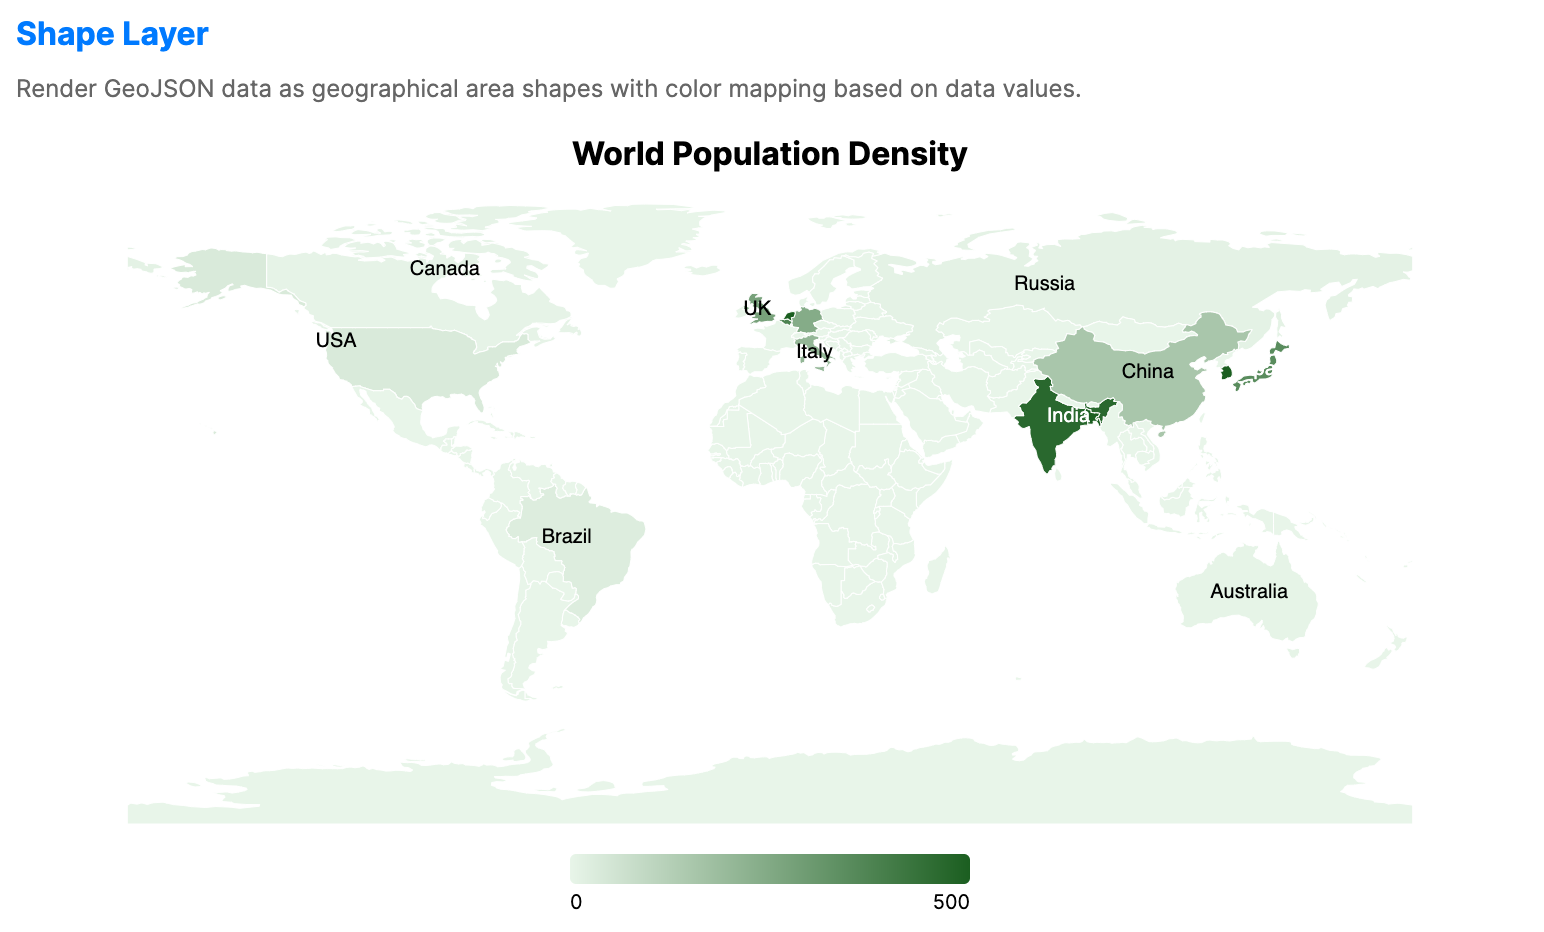
Choropleth map
info
Charts are available with Avalonia Pro.
Choropleth maps shade geographical areas in proportion to a statistical variable. They are suited to visualizing data density or trends across discrete regions.
When to use
- Demographics: Showing population density, income levels, or voting patterns.
- Market penetration: Visualizing sales performance across different territories.
- Environmental data: Showing climate data or resource distribution by region.
Code example
XAML
<ChoroplethMap xmlns="https://github.com/avaloniaui" Name="ChoroplethSample" Title="Population Density (Wrapper)" Height="400">
                        <ChoroplethMap.DataLayer>
                            <ShapeLayer GeoJson="{Binding WorldGeoJson}"
                                                 GeoJsonIdPath="ISO_A2"
                                                 MinValue="0"
                                                 MaxValue="500"
                                                 RegionPath="Code"
                                                 ValuePath="Density"
                                                 LowBrush="#E3F2FD"
                                                 HighBrush="#1565C0"
                                                 Stroke="#90A4AE"
                                                 ItemsSource="{Binding ShapeLayerData}">
                                <ShapeLayer.TooltipTemplate>
                                    <DataTemplate>
                                        <StackPanel Spacing="4">
                                            <TextBlock Text="{Binding Name}" FontWeight="Bold"/>
                                            <TextBlock Text="{Binding Density, StringFormat='Density: {0:N1} people/km²'}"/>
                                        </StackPanel>
                                    </DataTemplate>
                                </ShapeLayer.TooltipTemplate>
                            </ShapeLayer>
                        </ChoroplethMap.DataLayer>
                    </ChoroplethMap>
Data model (C#)
Ensure the GeoJSON file is included in your project and available at the specified relative path at runtime.
using System.IO;

public record CountryDensityData(string Code, string Name, double Density);

public string WorldGeoJson { get; } =
    File.ReadAllText("Resources/ne_110m_world.geojson");

public CountryDensityData[] ShapeLayerData { get; } = new CountryDensityData[]
{
    new("IN", "India", 464.0),
    new("BD", "Bangladesh", 1265.0),
    new("JP", "Japan", 347.0),
    new("KR", "S. Korea", 527.0),
    new("NL", "Netherlands", 508.0),
    new("BE", "Belgium", 376.0),
    new("GB", "UK", 275.0),
    new("DE", "Germany", 240.0),
    new("IT", "Italy", 206.0),
    new("FR", "France", 119.0),
    new("CN", "China", 153.0),
    new("US", "USA", 36.0),
    new("CA", "Canada", 4.0),
    new("BR", "Brazil", 25.0),
    new("RU", "Russia", 9.0),
    new("AU", "Australia", 3.0)
};
Common properties
| Property | Description | Default |
|---|---|---|
DataLayer | Canonical ShapeLayer used to render choropleth regions. A default layer is created automatically. | Auto-created ShapeLayer |
Common properties (DataLayer / ShapeLayer)
| Property | Description | Default |
|---|---|---|
ItemsSource | The collection of region data items. | null |
GeoJson | The GeoJSON geometry source. | null |
GeoJsonIdPath | Property name in the GeoJSON used to identify regions. | ISO_A2 |
RegionPath | Linking property name in the ItemsSource. | null |
ValuePath | Numerical property name for color intensity. | null |
MinValue | Minimum value used for color normalization. | 0.0 |
MaxValue | Maximum value used for color normalization. | 100.0 |
LowBrush | Brush used for the low end of the data range. | #E3F2FD |
HighBrush | Brush used for the high end of the data range. | #1565C0 |
Stroke | Brush used for region borders. | null |
TooltipTemplate | Data template used for map tooltips. | null |