Heatmap map
info
Charts are available with Avalonia Pro.
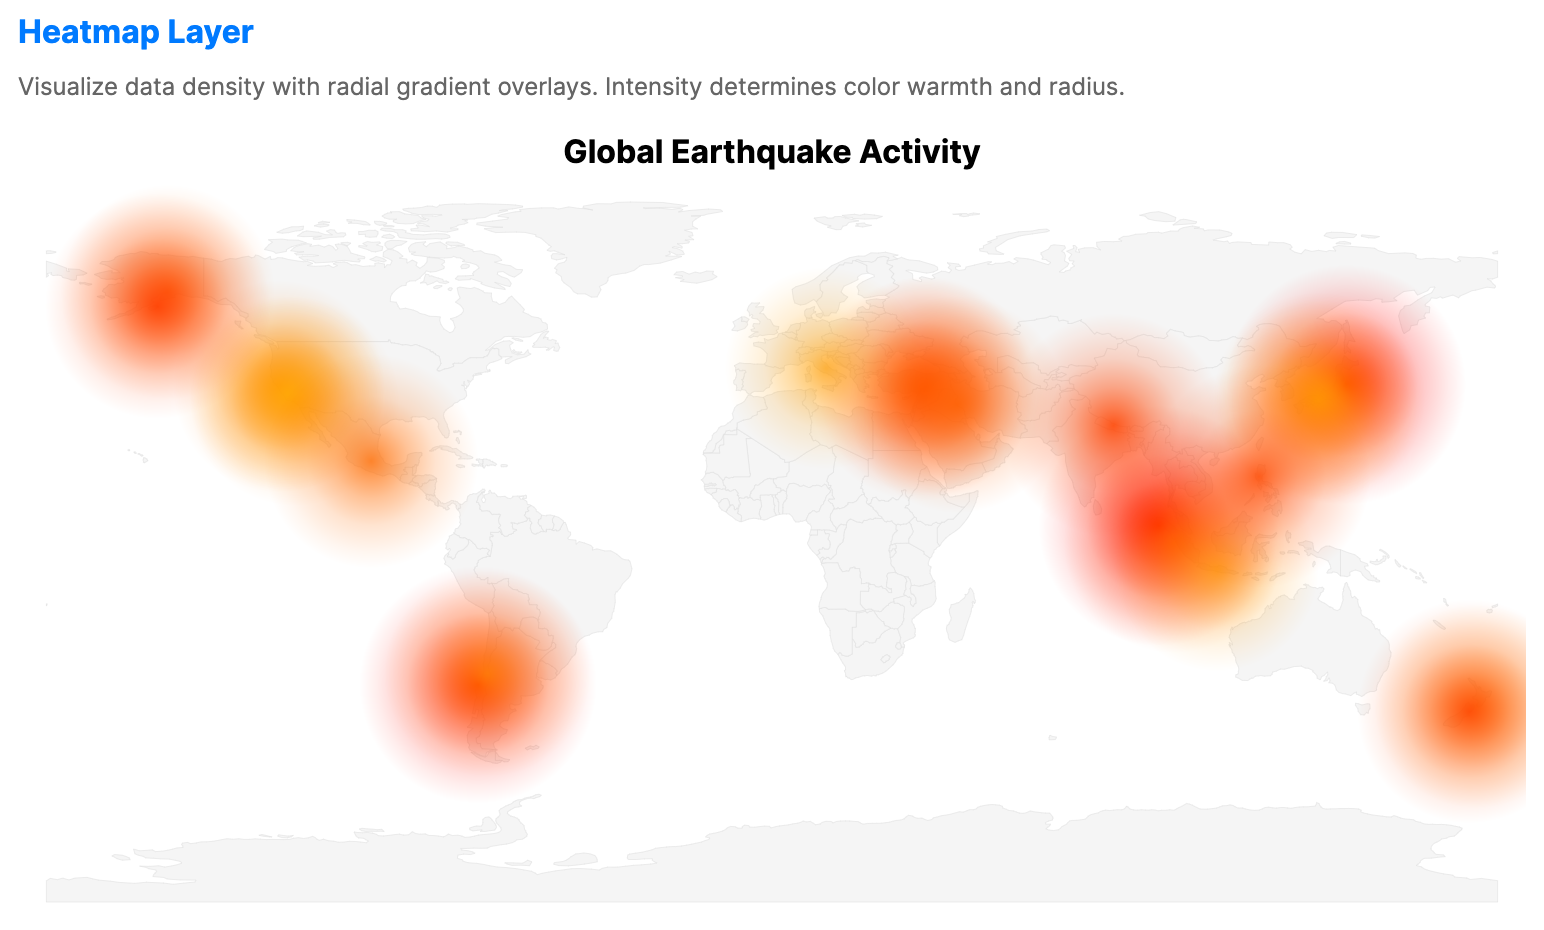
Heatmap maps visualize data density across geographic coordinates using a ShapeMap with a HeatmapLayer. They are suited to showing hot spots where activity is concentrated.
When to use
- User activity: Visualizing where mobile app users are most active geographically.
- Incident reporting: Mapping hotspots for crimes, traffic accidents, or outages.
- Environmental density: Showing concentrations of species or pollution.
Code example
XAML
<ShapeMap xmlns="https://github.com/avaloniaui" Name="HeatmapSample" Title="Global Earthquake Activity" Height="400" ShowLegend="False">
                        <ShapeMap.Layers>
                            <ShapeLayer GeoJson="{Binding WorldGeoJson}"
                                                 GeoJsonIdPath="ISO_A2"
                                                 LowBrush="#F5F5F5"
                                                 HighBrush="#F5F5F5"
                                                 Stroke="#E0E0E0"
                                                 StrokeThickness="0.3" />
                            <HeatmapLayer LatitudePath="Lat"
                                                   LongitudePath="Lon"
                                                   IntensityPath="Magnitude"
                                                   MaxIntensity="9.0"
                                                   Radius="50"
                                                   LowBrush="#4000FF00"
                                                   MediumBrush="#CCFFFF00"
                                                   HighBrush="#FFFF0000"
                                                   ItemsSource="{Binding EarthquakeData}">
                                <HeatmapLayer.TooltipTemplate>
                                    <DataTemplate>
                                        <StackPanel Spacing="4">
                                            <TextBlock Text="Earthquake" FontWeight="Bold"/>
                                            <TextBlock Text="{Binding Magnitude, StringFormat='Magnitude: {0:N1}'}"/>
                                        </StackPanel>
                                    </DataTemplate>
                                </HeatmapLayer.TooltipTemplate>
                            </HeatmapLayer>
                        </ShapeMap.Layers>
                    </ShapeMap>
Data model (C#)
Ensure the GeoJSON file is included in your project and available at the specified relative path at runtime.
using System.IO;

public record EarthquakeItem(double Lat, double Lon, double Magnitude);

public string WorldGeoJson { get; } =
    File.ReadAllText("Resources/ne_110m_world.geojson");

public EarthquakeItem[] EarthquakeData { get; } = new EarthquakeItem[]
{
    new(38.3, 142.4, 9.1),
    new(35.0, 135.8, 6.9),
    new(34.4, 135.3, 6.1),
    new(3.3, 95.9, 9.1),
    new(-0.8, 99.8, 7.6),
    new(-7.5, 110.4, 6.3),
    new(-36.1, -72.9, 8.8),
    new(-33.4, -70.6, 6.5),
    new(34.2, -118.4, 6.7),
    new(37.9, -122.3, 6.9),
    new(36.2, -120.2, 5.8),
    new(61.3, -149.9, 7.1),
    new(57.8, -152.4, 7.9),
    new(28.2, 84.7, 7.8),
    new(37.2, 37.0, 7.8),
    new(38.0, 38.5, 7.5),
    new(-41.5, 174.8, 6.3),
    new(-42.7, 173.0, 7.8),
    new(42.4, 13.4, 6.2),
    new(15.5, 120.8, 7.7),
    new(19.4, -99.4, 7.1),
    new(33.4, 46.0, 7.3)
};
Common properties (HeatmapLayer)
| Property | Description | Default |
|---|---|---|
ItemsSource | The collection of geographic points to render. | null |
LatitudePath | Property name for latitude values. | Latitude |
LongitudePath | Property name for longitude values. | Longitude |
IntensityPath | Property name for the intensity value. | Intensity |
Radius | Base radius of each heat spot in pixels. | 40.0 |
MaxIntensity | Maximum intensity used for normalization. | 100.0 |
LowBrush | Brush used for low intensity values. | #0000FF00 |
MediumBrush | Brush used for medium intensity values. | #FFFF00 |
HighBrush | Brush used for high intensity values. | #FF0000 |