Treemap chart
info
Charts are available with Avalonia Pro.
TreeMap charts visualize hierarchical or flat data as a set of nested rectangles. Each branch is given a rectangle, sized according to its value, and tiled with smaller sub-rectangles.
When to use
- Resource usage: Visualizing disk space or memory consumption by file/process.
- Proportional analysis: Comparing the weight of items within categories.
- Complex hierarchies: When you need to show many hierarchical items in a single view.
Code example
XAML
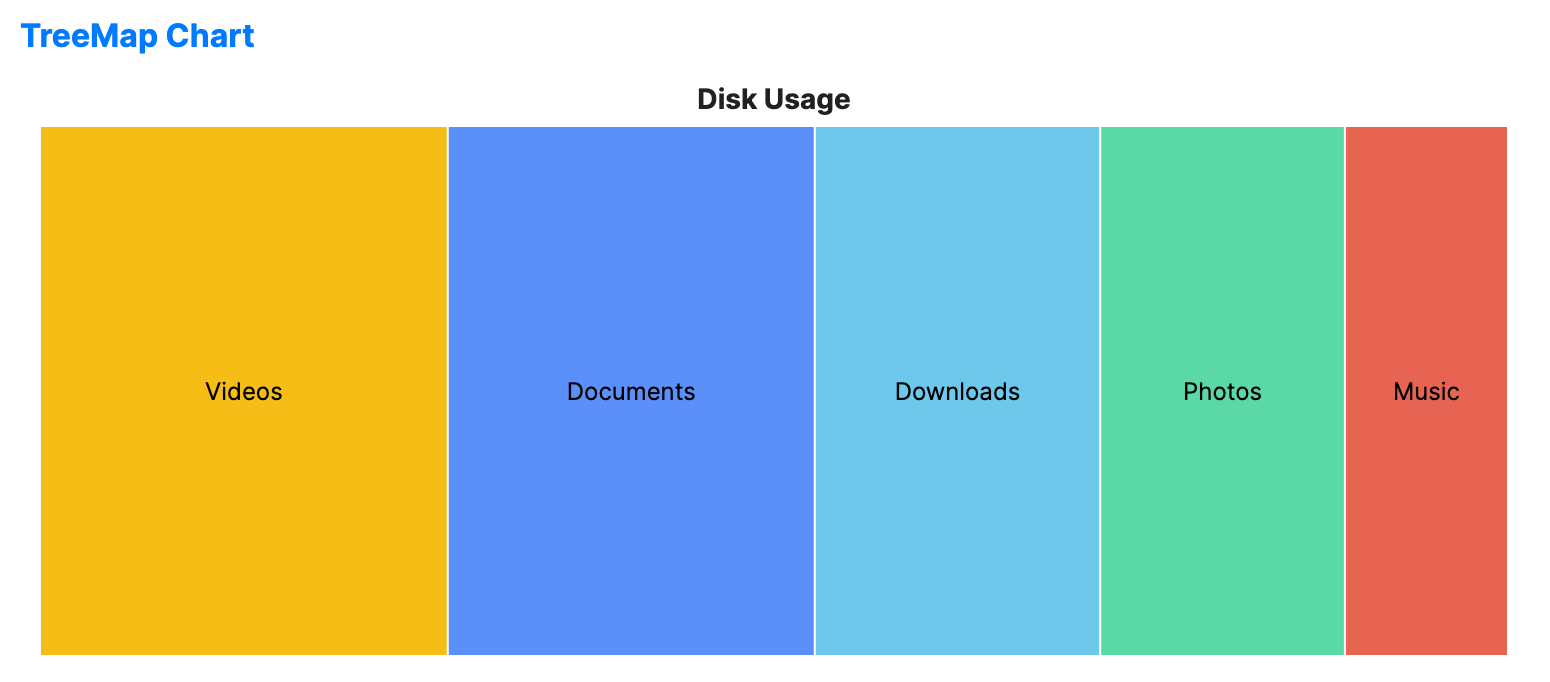
<TreeMapChart xmlns="https://github.com/avaloniaui" Name="TreeMapSample" Title="Disk Usage" Height="300"
                       ItemsSource="{Binding TreeMapData}" ValuePath="Size" LabelPath="Name" />
Data model (C#)
public record TreeMapItem(string Name, double Size);

public ObservableCollection<TreeMapItem> TreeMapData { get; } = new()
{
    new("Documents", 45),
    new("Photos", 30),
    new("Videos", 50),
    new("Music", 20),
    new("Downloads", 35)
};
Common properties
| Property | Description | Default |
|---|---|---|
Title | The chart title. | null |
ItemsSource | The collection of data items. | null |
ValuePath | Path to the property representing area size. | null |
LabelPath | Path to the property for the labels. | null |
TileGap | Gap between rectangles. | 1.0 |
IsHighlightEnabled | Enables hover highlighting for treemap nodes. | false |
IsSelectionEnabled | Enables node selection. | false |
SelectionMode | Selection behavior, such as None, Single, SingleDeselect, or Multiple. | SingleDeselect |
SelectionBrush | Brush used to highlight selected segments. | FromRgb(49, 74, 110) |
SelectionStroke | Brush used to outline selected segments. | Uses theme default. |
SelectionStrokeThickness | Thickness of the outline of selected segments. | 2.0 |
SelectedIndex | Index of the primary selected node. | -1 |