Dendrogram chart
info
Charts are available with Avalonia Pro.
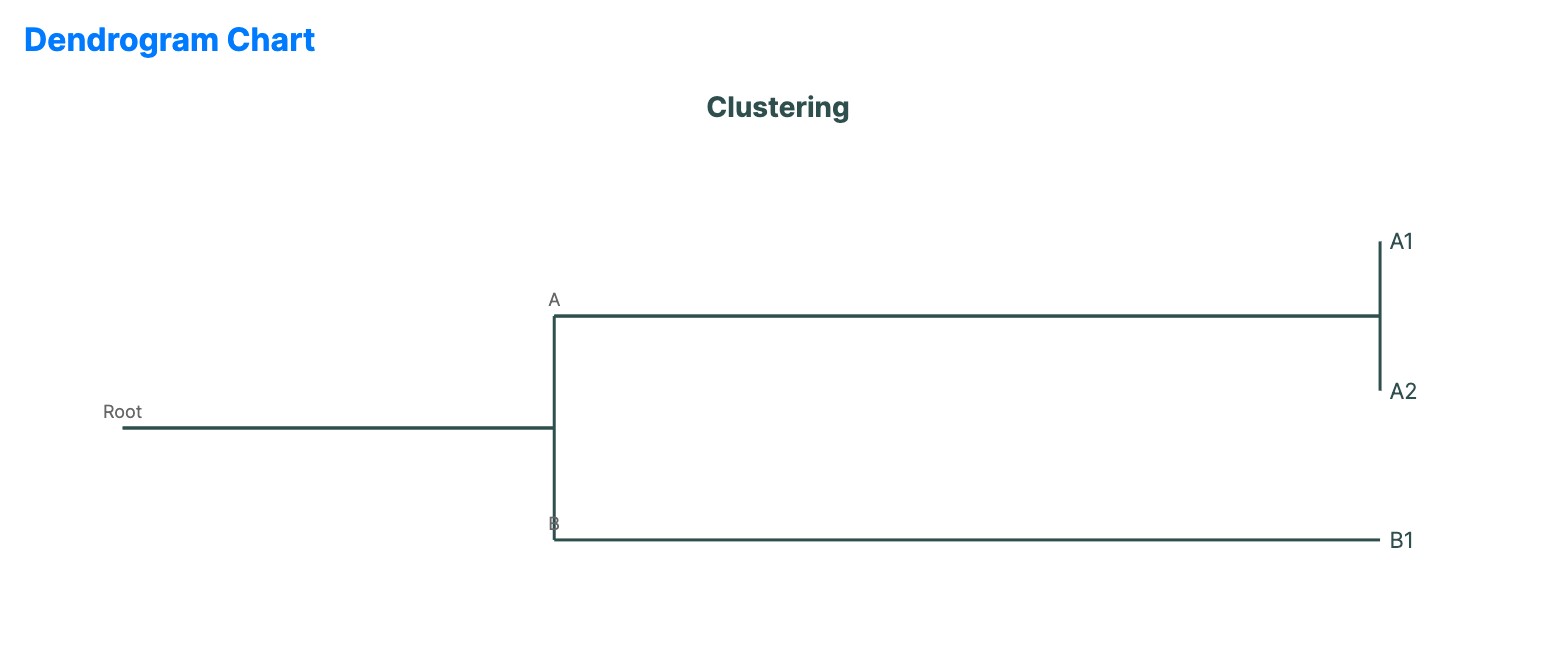
Dendrograms are tree diagrams frequently used to illustrate the arrangement of the clusters produced by hierarchical clustering. They show how items are merged into a single branch.
When to use
- Cluster analysis: Visualizing the results of statistical clustering algorithms.
- Phylogenetic trees: Showing evolutionary relationships between different species.
- Structural merges: Representing data that stems from many parts but converges into a few groups.
Code example
XAML
<DendrogramChart xmlns="https://github.com/avaloniaui" Name="DendrogramChartSample" Title="Clustering" Height="300"
                          ItemsSource="{Binding DendrogramData}"
                          LabelPath="Name"
                          ChildrenPath="Children" />
Data model (C#)
public class TreeNode
{
    public string Name { get; set; } = string.Empty;
    public ObservableCollection<TreeNode> Children { get; set; } = new();
}

public ObservableCollection<TreeNode> DendrogramData { get; } = new()
{
    new TreeNode { Name = "Root", Children = {
        new TreeNode { Name = "A", Children = {
            new TreeNode { Name = "A1" },
            new TreeNode { Name = "A2" }
        }},
        new TreeNode { Name = "B", Children = {
            new TreeNode { Name = "B1" }
        }}
    }}
};
Common properties
| Property | Description | Default |
|---|---|---|
ItemsSource | The hierarchical cluster data. | null |
LabelPath | Property for the leaf or node names. | null |
ChildrenPath | Path to the nested cluster items. | null |
DistancePath | Property for the cluster distance or merge height. | null |
Orientation | Orientation of the chart, Horizontal or Vertical. | Horizontal |
LinkStyle | Style of the lines linking items, Elbow or Straight. | Elbow |
LeafSpacing | Spacing between leaf nodes. | 25.0 |