Arc diagram
info
Charts are available with Avalonia Pro.
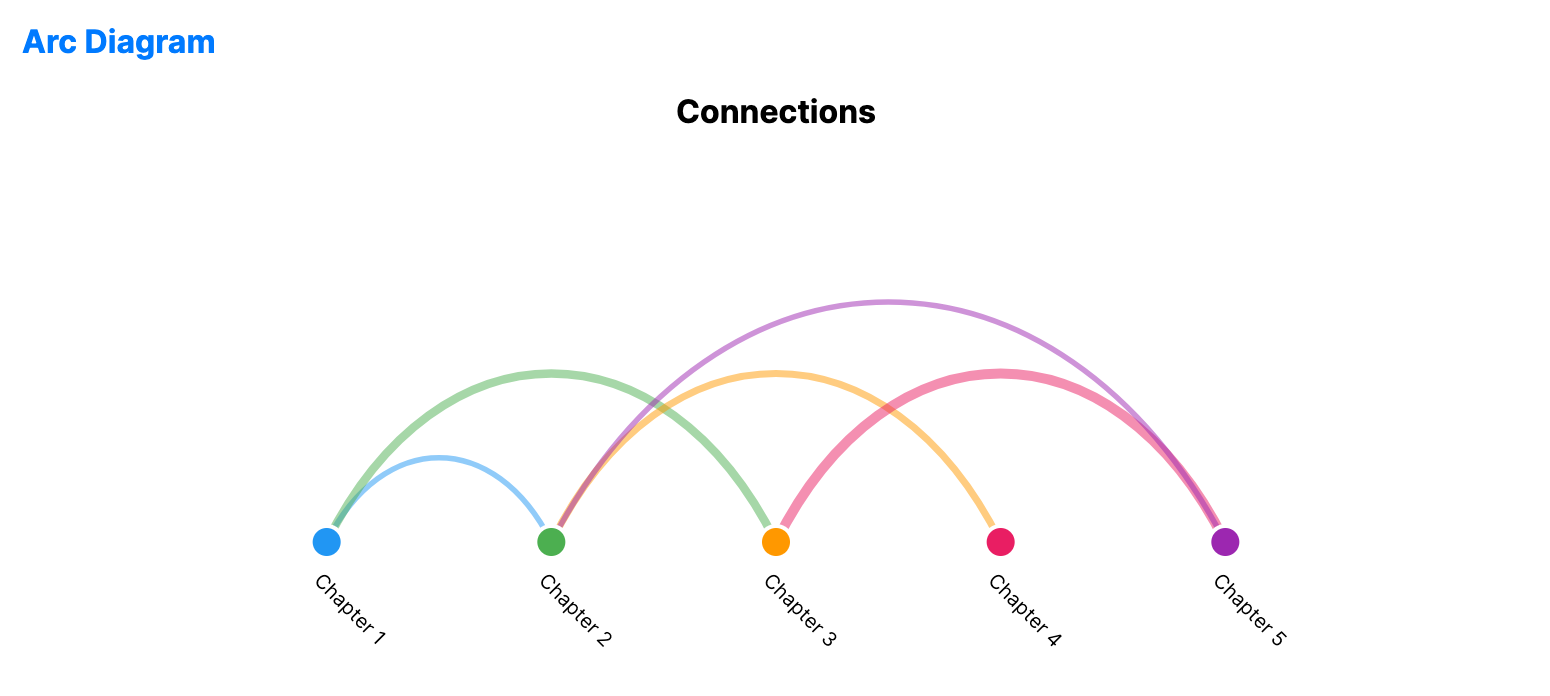
Arc diagrams are network visualizations where nodes are placed linearly along an axis. Connections are drawn as curved arcs, with the thickness or color representing link strength.
When to use
- Sequence analysis: Showing relationships between items in a fixed order (e.g., chapters in a book).
- Dependency mapping: Visualizing call stacks or structural relationships on a single line.
- Categorical proximity: Highlighting clusters of interactions within a linear dataset.
Code example
XAML
<ArcDiagramChart xmlns="https://github.com/avaloniaui" Name="ArcDiagramSample" Title="Connections" Height="300"
                          Nodes="{Binding ArcNodes}"
                          Links="{Binding ArcLinks}"
                          NodeIdPath="Id"
                          NodeLabelPath="Label"
                          SourcePath="Source"
                          TargetPath="Target"
                          LinkValuePath="Value" />
Data model (C#)
public record ArcNode(string Id, string Label);
public record ArcLink(string Source, string Target, double Value);

public ObservableCollection<ArcNode> ArcNodes { get; } = new()
{
    new("1", "Chapter 1"),
    new("2", "Chapter 2"),
    new("3", "Chapter 3"),
    new("4", "Chapter 4"),
    new("5", "Chapter 5")
};

public ObservableCollection<ArcLink> ArcLinks { get; } = new()
{
    new("1", "2", 1),
    new("1", "3", 3),
    new("2", "4", 2),
    new("3", "5", 4),
    new("2", "5", 1)
};
Common properties
| Property | Description | Default |
|---|---|---|
Nodes | The collection of items on the axis. | null |
Links | The relationships between nodes. | null |
NodeIdPath | Path to the unique identifier for each node. | null |
NodeLabelPath | Path to the text for each node. | null |
SourcePath | Path to the source node identifier for each link. | null |
TargetPath | Path to the target node identifier for each link. | null |
LinkValuePath | Path determining the arc thickness/size. | null |
NodeSize | Size of the node markers. | 16.0 |
ArcThickness | Base thickness of the connection arcs. | 2.0 |
ArcOpacity | Opacity of the connection arcs. | 0.5 |