Chord diagram
info
Charts are available with Avalonia Pro.
Chord diagrams visualize the inter-relationships between entities in a circular layout. They are useful for showing complex directional flows between a set of items.
When to use
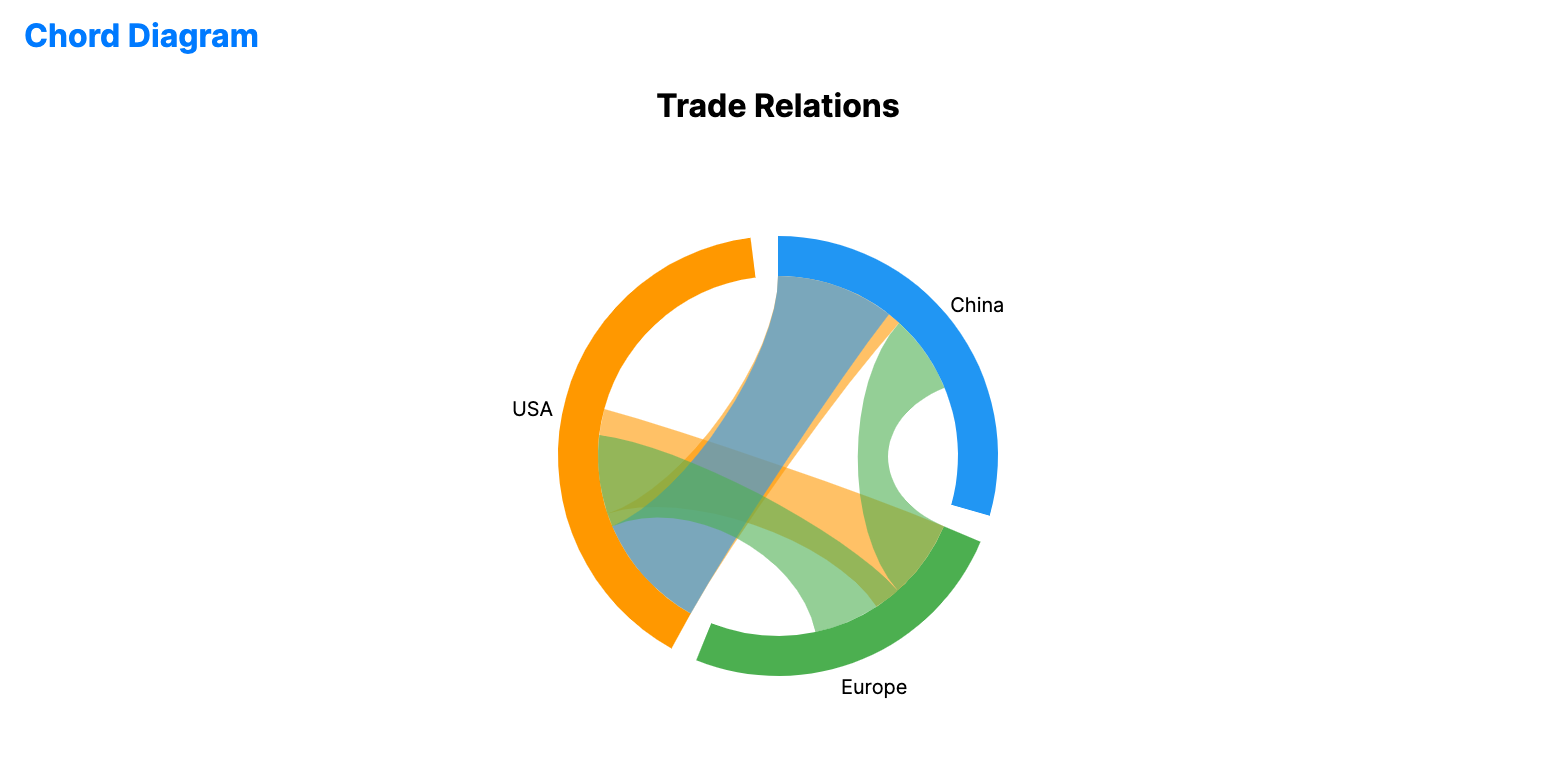
- Trade relations: Visualizing import/export relationships between countries.
- Migration patterns: Showing movement of people between different geographic areas.
- System interactions: Visualizing call dependencies between modules in a software system.
Code example
XAML
<ChordDiagramChart xmlns="https://github.com/avaloniaui" Name="ChordDiagramSample" Title="Trade Relations" Height="350"
                            ItemsSource="{Binding ChordData}"
                            SourcePath="Source"
                            TargetPath="Target"
                            ValuePath="Value" />
Data model (C#)
public record TradeLink(string Source, string Target, double Value);

public ObservableCollection<TradeLink> ChordData { get; } = new()
{
    new("USA", "China", 50),
    new("USA", "Europe", 40),
    new("Europe", "China", 30),
    new("China", "USA", 45),
    new("Europe", "USA", 35)
};
Common properties
| Property | Description | Default |
|---|---|---|
ItemsSource | The collection of relationships. | null |
SourcePath | Path to the source entity. | null |
TargetPath | Path to the target entity. | null |
ValuePath | Path to the relationship strength/weight. | null |
ArcPadding | Angular spacing between segments on the outer ring. | 0.02 |
ArcThickness | Thickness of the outer arcs. | 20.0 |
ChordOpacity | Opacity applied to the connecting chords. | 0.6 |
ShowLabels | Whether to display labels for the outer arcs. | true |