Icicle chart
info
Charts are available with Avalonia Pro.
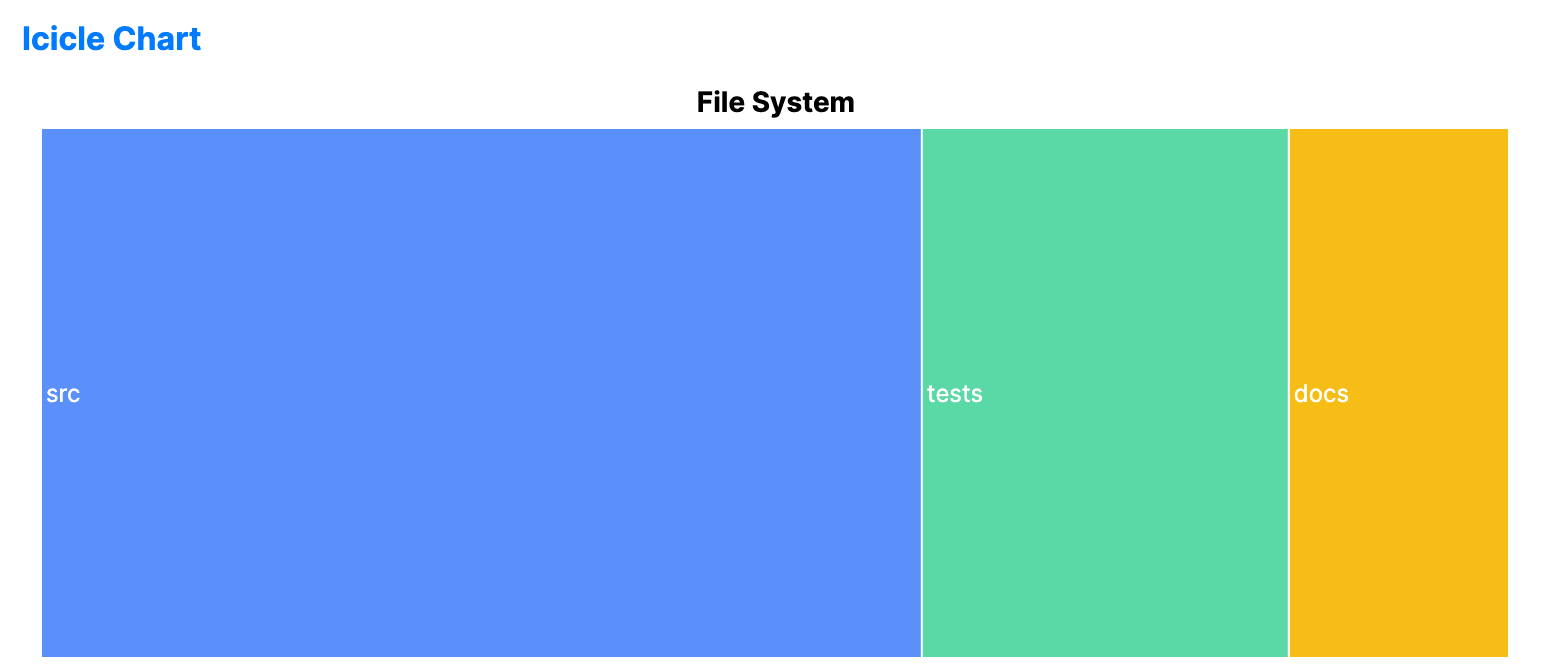
Icicle charts visualize hierarchical data using rectangles placed side by side. Each level in the hierarchy's depth is represented by a row or column, showing parent-child relationships across levels.
When to use
- Structural analysis: Inspecting codebases, directory structures, or large taxonomies.
- Performance profiling: Visualizing call stacks or execution paths.
- Relationship discovery: Finding the root cause of leaf-node values within a large tree.
Code example
XAML
<IcicleChart xmlns="https://github.com/avaloniaui" Name="IcicleChartSample" Title="File System" Height="300"
                      ItemsSource="{Binding IcicleData}"
                      ValuePath="Size"
                      LabelPath="Name" />
Data model (C#)
public record TreeMapItem(string Name, double Size);

public ObservableCollection<TreeMapItem> IcicleData { get; } = new()
{
    new("src", 60),
    new("tests", 25),
    new("docs", 15)
};
Common properties
| Property | Description | Default |
|---|---|---|
ItemsSource | The hierarchical data source. | null |
ValuePath | Property name determining rectangle width. | null |
LabelPath | Property name for the text label. | null |
ChildrenPath | Path to the collection of child nodes. | null |
Orientation | Orientation of the chart, Horizontal or Vertical. | Vertical |
TileGap | Gap between adjacent rectangles. | 1.0 |