Word cloud
info
Charts are available with Avalonia Pro.
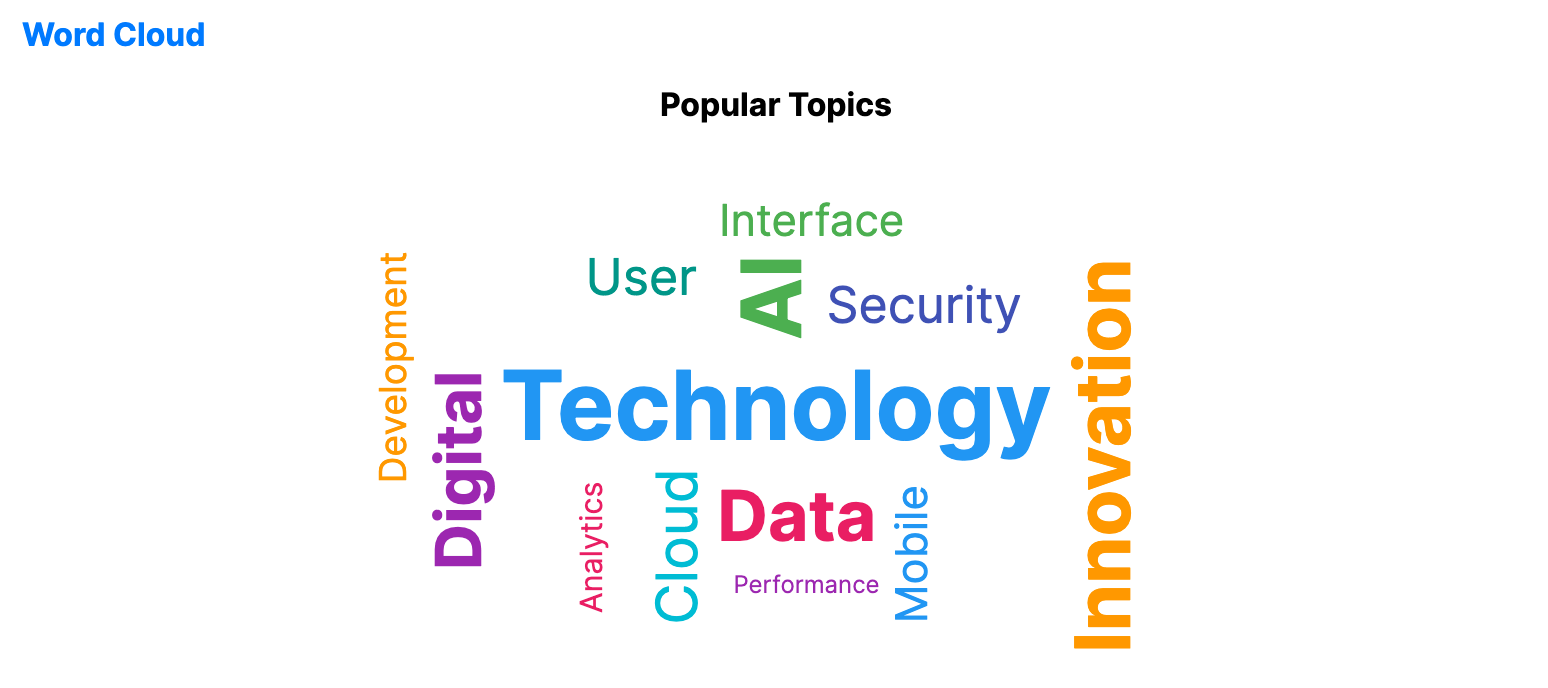
Word clouds represent text data by varying word size based on frequency or importance. They provide an immediate visual summary of qualitative content or popular topics.
When to use
- Search Trends: Visualizing the most common keywords in a query log.
- Sentiment Analysis: Highlighting prominent words in customer reviews.
- Content Summarization: Showing the main themes of a long article or document.
Code example
XAML
<WordCloudChart xmlns="https://github.com/avaloniaui" Title="Popular Topics" Height="300"
                                             ItemsSource="{Binding WordCloudData}"
                                             WordPath="Word" WeightPath="Count"/>
Data model (C#)
public record WordItem(string Word, double Count);

public ObservableCollection<WordItem> WordCloudData { get; } = new()
{
    new("Technology", 80),
    new("Innovation", 65),
    new("Digital", 55),
    new("Cloud", 50),
    new("AI", 70),
    new("Data", 60),
    new("Security", 45),
    new("Mobile", 40),
    new("Development", 35),
    new("Analytics", 30),
    new("Performance", 25),
    new("User", 45),
    new("Interface", 40)
};
Common properties
| Property | Description | Default |
|---|---|---|
ItemsSource | The collection of word/weight data. | null |
WordPath | Property name for the actual text word. | null |
WeightPath | Numerical property determining font size. | null |
MinFontSize | Smallest font size in pixels. | 12.0 |
MaxFontSize | Largest font size in pixels. | 48.0 |
MaxWords | Maximum number of words rendered. | 50 |
RotateWords | Whether some words may be rotated vertically. | true |