Matrix chart
info
Charts are available with Avalonia Pro.
Matrix charts use a grid to visualize boolean relationships between two categorical sets. They are a good fit for showing whether a feature, status, or permission is present at the intersection of rows and columns.
When to use
- Correlation tables: Showing the relationship between many different variables.
- Schedule overviews: Mapping availability or events across people and days.
- Attribute comparison: Visualizing which features (columns) apply to which products (rows).
Code example
XAML
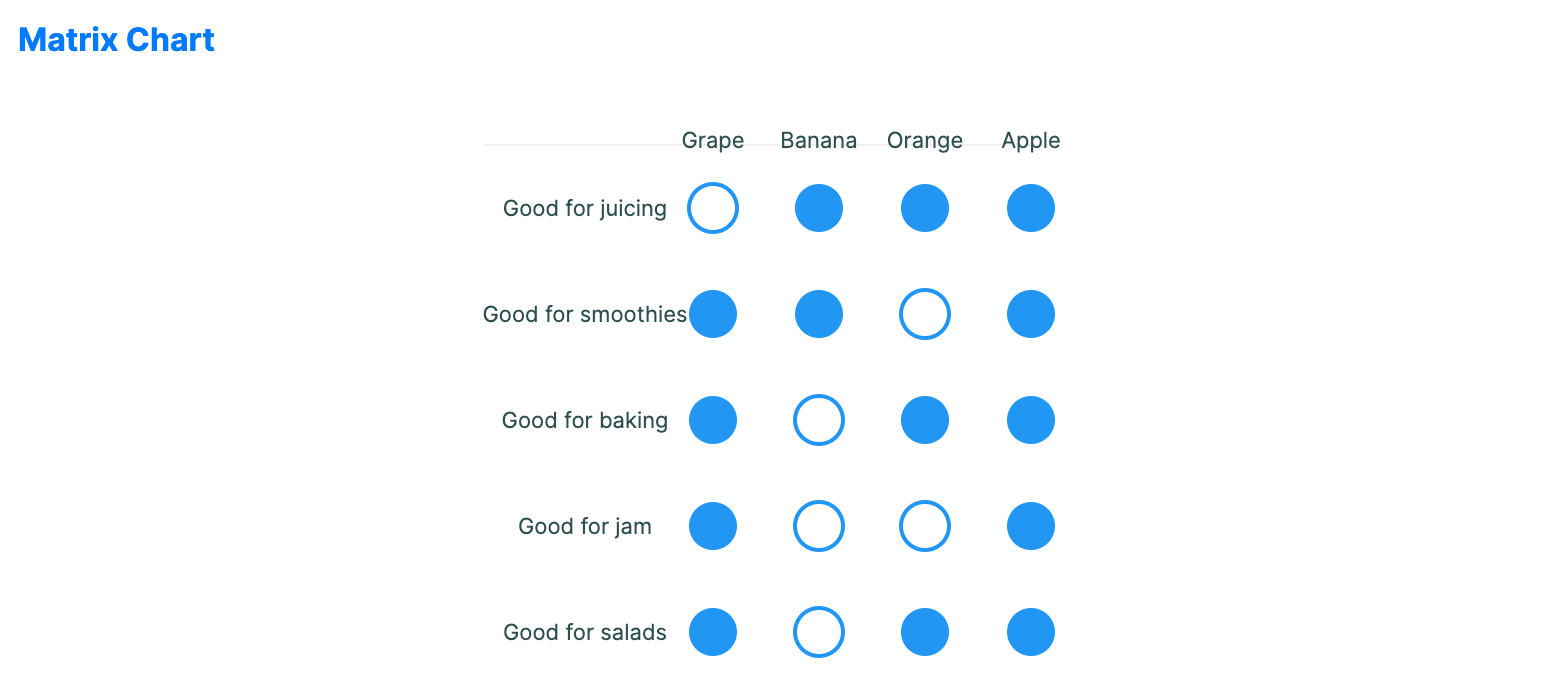
<MatrixChart xmlns="https://github.com/avaloniaui" Title="Fruit Attributes" Height="300"
                                          ItemsSource="{Binding MatrixData}"
                                          ColumnLabels="{Binding MatrixColumns}"
                                          RowLabelPath="Attribute" ValuesPath="Values"
                                          CellSize="28" CellGap="25"/>
Data model (C#)
public record MatrixItem(string Attribute, bool[] Values);

public ObservableCollection<string> MatrixColumns { get; } = new()
{
    "Grape", "Banana", "Orange", "Apple"
};

public ObservableCollection<MatrixItem> MatrixData { get; } = new()
{
    new("Good for juicing", new[] { false, true, true, true }),
    new("Good for smoothies", new[] { true, true, false, true }),
    new("Good for baking", new[] { true, false, true, true }),
    new("Good for jam", new[] { true, false, false, true }),
    new("Good for salads", new[] { true, false, true, true })
};
Common properties
| Property | Description | Default |
|---|---|---|
ItemsSource | The collection of row data. | null |
RowLabelPath | Path to the row label property. | null |
ColumnLabels | The list of column labels shown across the top. | null |
ValuesPath | Path to the boolean values for the row's cells. | null |
CellSize | The diameter of each matrix cell. | 30.0 |
CellGap | The gap between cells. | 2.0 |
TrueBrush | Brush used for true values. | null |
FalseBrush | Brush used for false values. | null |
ShowFilledCircles | Whether true values are filled instead of outlined. | true |
ShowRowLabels | Whether to display labels for each row. | true |
ShowColumnLabels | Whether to display labels for each column. | true |
LabelFontSize | Font size used for row and column labels. | 11.0 |
IsHighlightEnabled | Enables hover highlighting for matrix cells. | false |