Heatmap
info
Charts are available with Avalonia Pro.
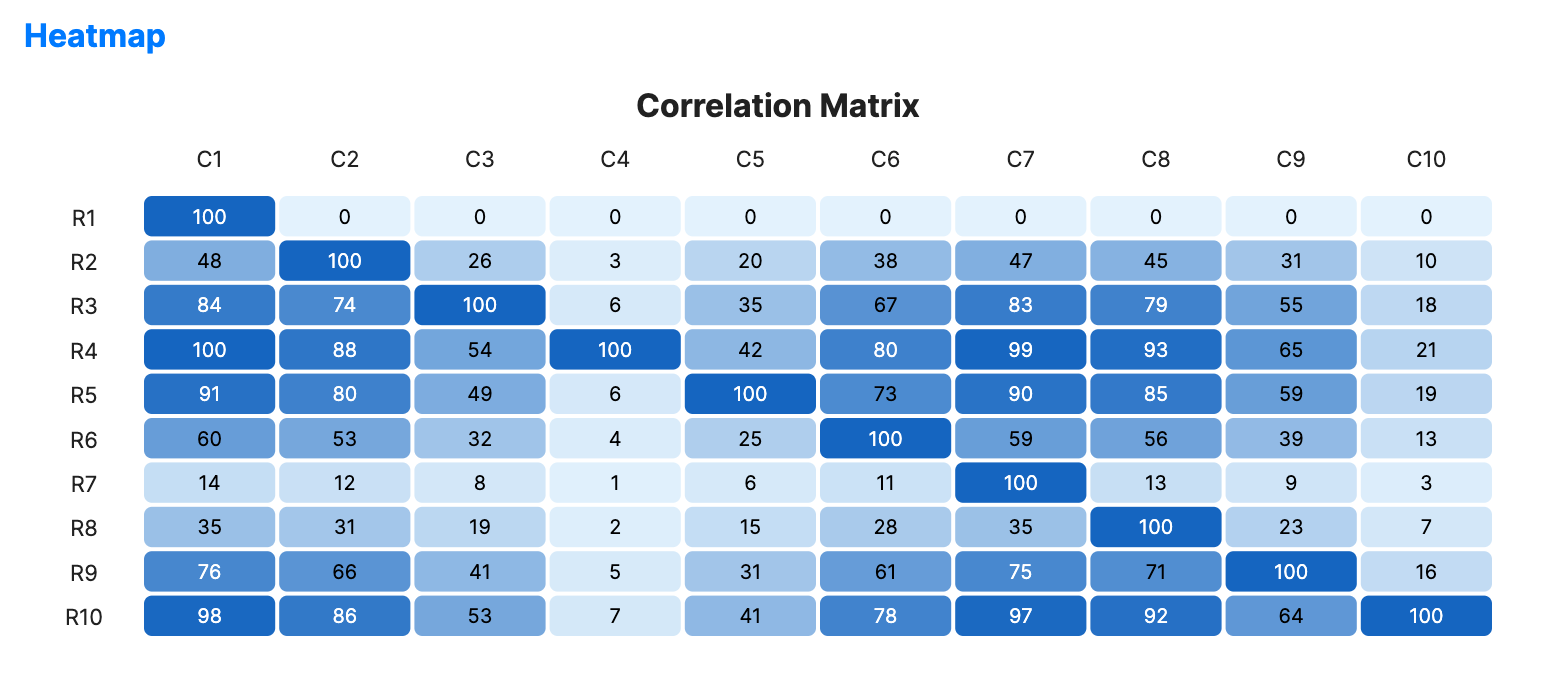
Heatmaps use color-coded cells to represent data values in a 2D matrix, highlighting patterns, correlations, and outliers across two dimensions.
When to use
- Correlation matrices: Visualizing the relationship between variables.
- Density mapping: Showing frequency or intensity across two categories.
- Matrix data: When visualizing numerical values at the intersection of rows and columns.
Code example
XAML
<HeatmapChart xmlns="https://github.com/avaloniaui" Title="Correlation Matrix" Height="300"
                       ItemsSource="{Binding HeatmapData}"
                       RowPath="Row" ColumnPath="Col" ValuePath="Val"/>
Data model (C#)
using System;

public record HeatmapItem(string Row, string Col, double Val);

public ObservableCollection<HeatmapItem> HeatmapData { get; } = CreateHeatmapData();

private static ObservableCollection<HeatmapItem> CreateHeatmapData()
{
    var data = new ObservableCollection<HeatmapItem>();
    const int size = 10;

    for (var row = 0; row < size; row++)
    {
        for (var column = 0; column < size; column++)
        {
            var value = Math.Abs(Math.Sin(row * 0.5) * Math.Cos(column * 0.5) * 100);
            if (row == column)
            {
                value = 100;
            }

            data.Add(new($"R{row + 1}", $"C{column + 1}", value));
        }
    }

    return data;
}
Common properties
| Property | Description | Default |
|---|---|---|
Title | The chart title. | null |
ItemsSource | The collection representing the matrix data. | null |
RowPath | Path to the property for the row identifier. | null |
ColumnPath | Path to the property for the column identifier. | null |
ValuePath | Path to the property for cell values. | null |
LowBrush | Brush used for the lowest values. | #E3F2FD |
HighBrush | Brush used for the highest values. | #1565C0 |
ShowLabels | Whether to display the value inside each cell. | true |
CellGap | Size of gap between cells. | 2.0 |
CellCornerRadius | Corner radius of each cell. | CornerRadius(4) |
LabelFontSize | Font size used for row labels, column labels, and cell values. | 11.0 |
LabelForeground | Brush used for row and column labels. Cell values use contrast-aware text. | null |
IsHighlightEnabled | Enables hover highlighting for heatmap cells. | false |