Theme river chart
info
Charts are available with Avalonia Pro.
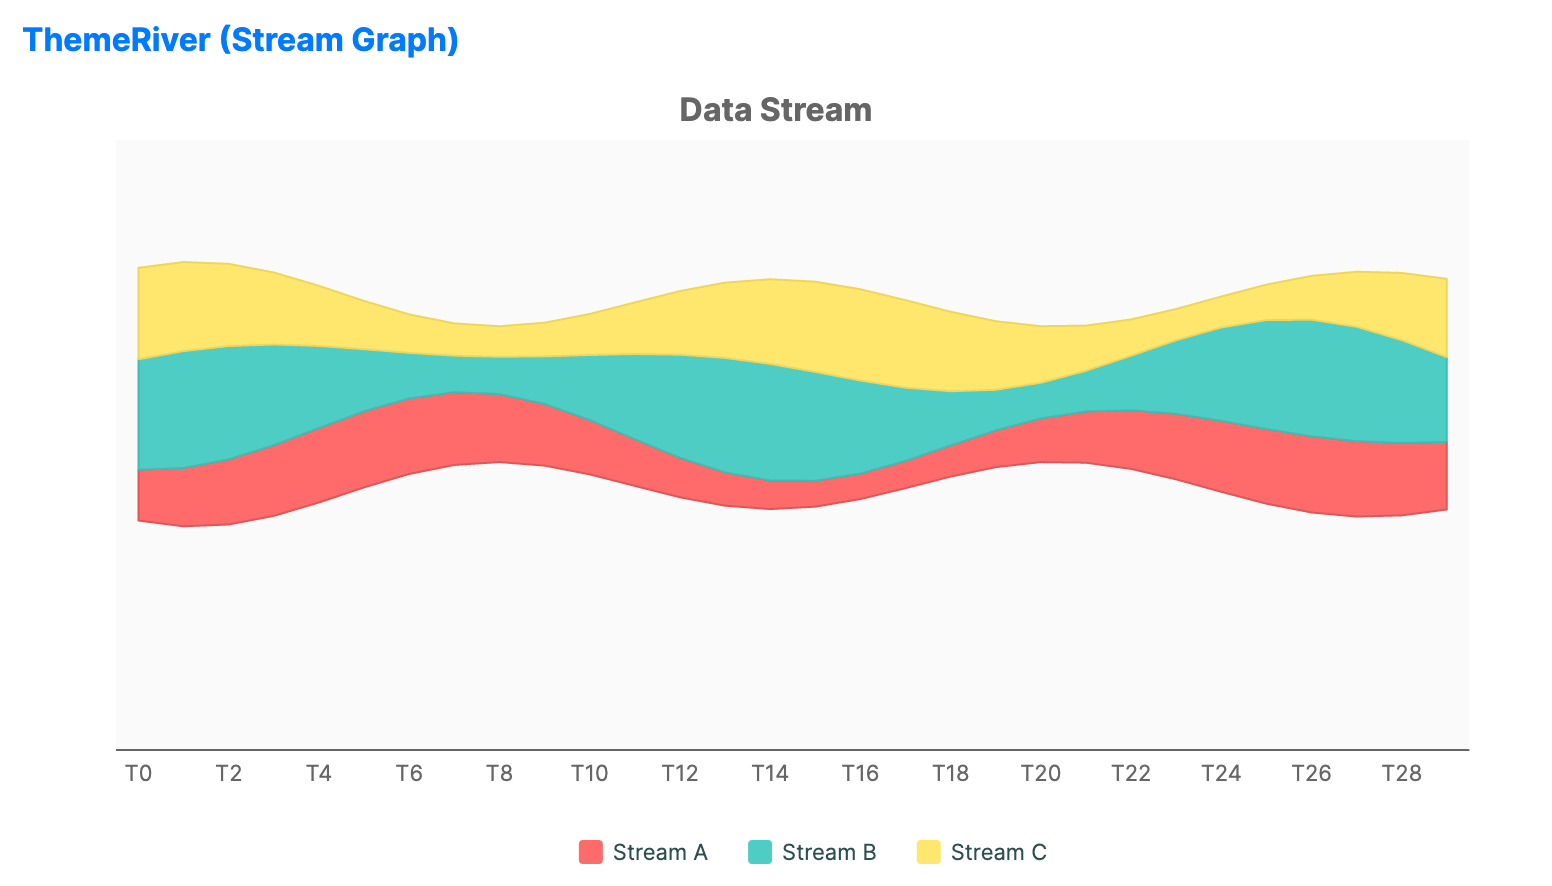
Theme river charts visualize changes in categories over time. In Avalonia.Controls.Charts, this layout can be built by combining multiple StackedAreaSeries instances inside a CartesianChart.
When to use
- Topic trends: Visualizing the popularity of themes in news or social media over time.
- Resource allocation: Showing how budget or manpower shifts between projects.
- Usage patterns: Tracking the volume of different types of network traffic.
Code example
XAML
<CartesianChart xmlns="https://github.com/avaloniaui" Name="ThemeRiverSample" Title="Data Stream" Height="400"
                                           ShowLegend="True" LegendPosition="Bottom">
                        <CartesianChart.Series>
                            <!-- Dummy Series (Transparent Spacer for Wiggle/Centering) -->
                            <StackedAreaSeries Title="" ItemsSource="{Binding ThemeRiverDummy}"
                                                      CategoryPath="Category" ValuePath="Value"
                                                      StackGroup="River"
                                                      Fill="Transparent"
                                                      StrokeThickness="0" />

                            <!-- Visible Data Series -->
                            <StackedAreaSeries Title="Stream A" ItemsSource="{Binding ThemeRiverSeriesA}"
                                                      CategoryPath="Category" ValuePath="Value"
                                                      StackGroup="River"
                                                      Fill="#FF6B6B" Stroke="#E05555" StrokeThickness="1" />

                            <StackedAreaSeries Title="Stream B" ItemsSource="{Binding ThemeRiverSeriesB}"
                                                      CategoryPath="Category" ValuePath="Value"
                                                      StackGroup="River"
                                                      Fill="#4ECDC4" Stroke="#3EBDB4" StrokeThickness="1" />

                            <StackedAreaSeries Title="Stream C" ItemsSource="{Binding ThemeRiverSeriesC}"
                                                      CategoryPath="Category" ValuePath="Value"
                                                      StackGroup="River"
                                                      Fill="#FFE66D" Stroke="#EED55D" StrokeThickness="1" />
                        </CartesianChart.Series>

                        <CartesianChart.HorizontalAxis>
                             <CategoryAxis ShowGridLines="False" />
                        </CartesianChart.HorizontalAxis>

                        <CartesianChart.VerticalAxis>
                             <NumericalAxis ShowGridLines="False" IsVisible="False" />
                        </CartesianChart.VerticalAxis>
                    </CartesianChart>
Data model (C#)
using System.Collections.Generic;

public class ThemeRiverViewModel
{
    public List<ThemeRiverItem> ThemeRiverDummy { get; } = new();
    public List<ThemeRiverItem> ThemeRiverSeriesA { get; } = new();
    public List<ThemeRiverItem> ThemeRiverSeriesB { get; } = new();
    public List<ThemeRiverItem> ThemeRiverSeriesC { get; } = new();

    public ThemeRiverViewModel()
    {
        GenerateThemeRiverData();
    }

    private void GenerateThemeRiverData()
    {
        const int count = 30;
        const double center = 50.0;

        for (var i = 0; i < count; i++)
        {
            var category = $"T{i}";
            var streamA = 10 + 5 * System.Math.Sin(i * 0.3);
            var streamB = 15 + 8 * System.Math.Sin(i * 0.5 + 1);
            var streamC = 12 + 6 * System.Math.Cos(i * 0.4);
            var offset = center - (streamA + streamB + streamC) / 2;

            ThemeRiverDummy.Add(new ThemeRiverItem { Category = category, Value = offset });
            ThemeRiverSeriesA.Add(new ThemeRiverItem { Category = category, Value = streamA });
            ThemeRiverSeriesB.Add(new ThemeRiverItem { Category = category, Value = streamB });
            ThemeRiverSeriesC.Add(new ThemeRiverItem { Category = category, Value = streamC });
        }
    }
}

public class ThemeRiverItem
{
    public string Category { get; set; } = string.Empty;
    public double Value { get; set; }
}
Common properties (StackedAreaSeries)
| Property | Description | Default |
|---|---|---|
Title | Series name shown in the legend. | null |
ItemsSource | The collection of data points for a single stream. | null |
CategoryPath | Property used for the horizontal category or time bucket. | null |
ValuePath | Property determining the thickness of the stream. | null |
StackGroup | Stack group shared by the related area series. | null |
Fill | Brush used for the stream area. | Theme-dependent |
Stroke | Brush used for the stream outline. | Theme-dependent |