Slope chart
info
Charts are available with Avalonia Pro.
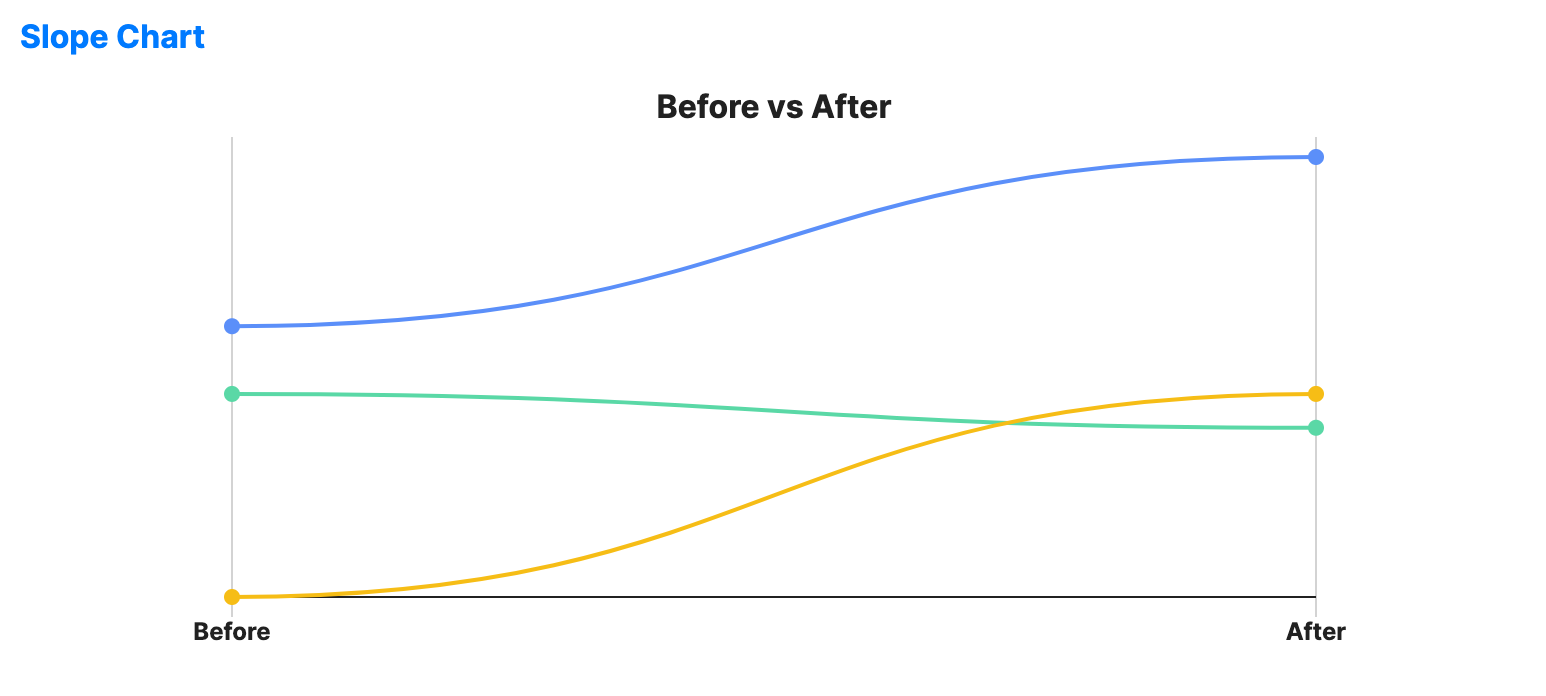
Slope charts compare two points in time (or two categories) for multiple entities. They are ideal for visualizing the change in rank or value between two states.
When to use
- Before/after analysis: Showing the impact of a policy or event across different groups.
- Rank shifts: Visualizing how product popularity changed between two quarters.
- Comparison of two states: Highlighting which entities improved and which declined.
Code example
XAML
<SlopeChart xmlns="https://github.com/avaloniaui" Name="SlopeChartSample"
                                         Title="Before vs After"
                                         Height="300"
                                         LabelPath="Label"
                                         StartValuePath="Before"
                                         EndValuePath="After"
                                         IsCurved="True"
                                         ShowGridLines="True"
                                         ShowXAxis="True"
                                         ItemsSource="{Binding SlopeData}" />
Data model (C#)
public record SlopeItem(string Label, double Before, double After);

public ObservableCollection<SlopeItem> SlopeData { get; } = new()
{
    new("Sales", 100.0, 150.0),
    new("Cost", 80.0, 70.0),
    new("Profit", 20.0, 80.0)
};
Common properties
| Property | Description | Default |
|---|---|---|
ItemsSource | The collection of items to compare. | null |
LabelPath | Path to the entity name. | null |
StartValuePath | Path to the first value shown on the left side. | null |
EndValuePath | Path to the second value shown on the right side. | null |
StartLabel | Label displayed for the left side. | "Before" |
EndLabel | Label displayed for the right side. | "After" |
StrokeThickness | Width of the connecting lines. | 2.0 |
MarkerSize | Size of the markers at the start and end of each line. | 8.0 |
ShowLabels | Toggles the start and end value labels. | true |
IsCurved | Draws curved lines instead of straight connectors. | false |
ShowGridLines | Whether to draw guide lines for the start and end positions. | false |
ShowXAxis | Whether to draw the bottom axis and move the side labels below the chart. | false |
IsHighlightEnabled | Enables hover highlighting for slope lines. | false |