Renko chart
info
Charts are available with Avalonia Pro.
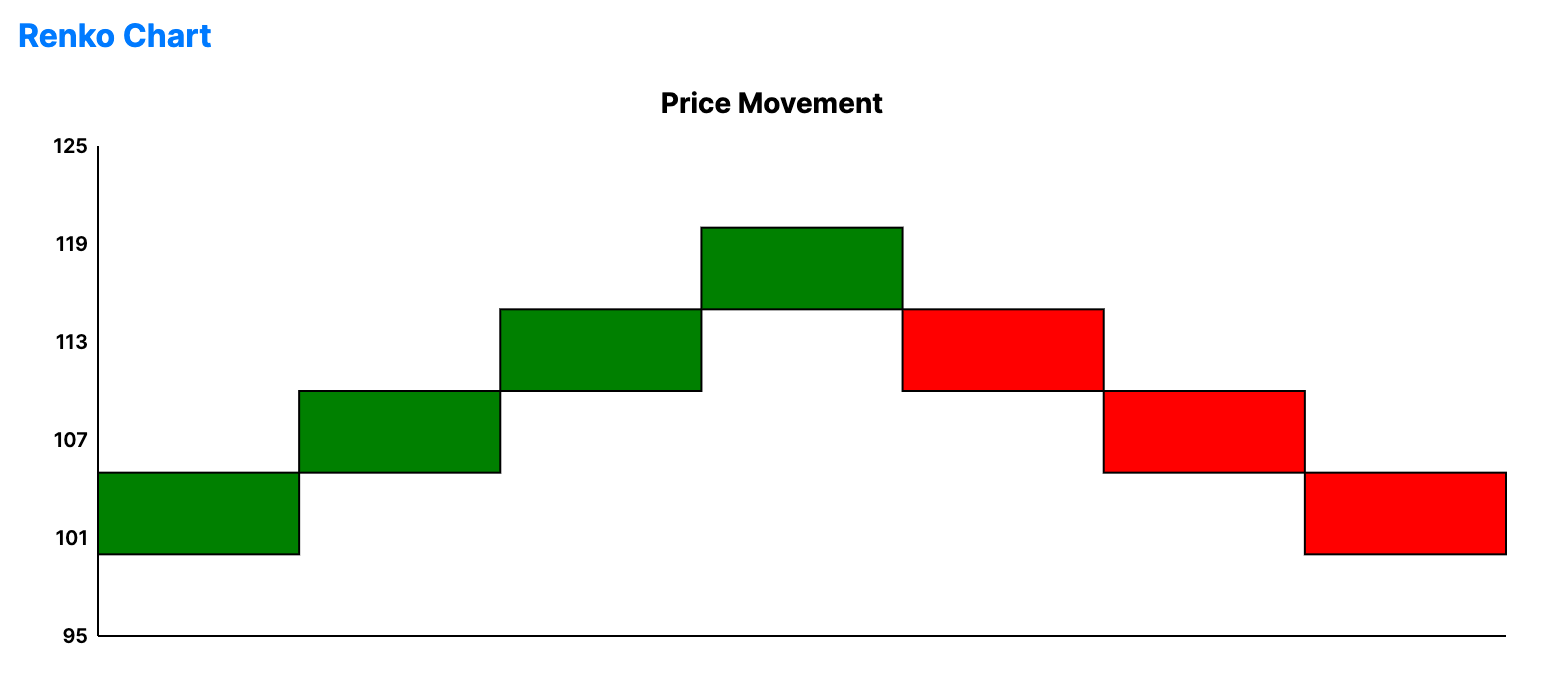
Renko charts are made of "bricks" that represent a fixed price movement. A new brick is only added if price moves by the specified brick size, filtering out time and minor volatility.
When to use
- Support and resistance: Identifying clear levels where bricks frequently reverse.
- Trend confirmation: Spotting persistent bullish/bearish brick sequences.
- Clean visualization: Simplifying complex, noisy price data into uniform blocks.
Code example
XAML
<RenkoChart xmlns="https://github.com/avaloniaui" Name="RenkoChartSample" Title="Price Movement" Height="300" BrickSize="5"
                                         ItemsSource="{Binding RenkoData}"
                                         ValuePath="Value" />
Data model (C#)
public record RenkoPoint(double Value);

public ObservableCollection<RenkoPoint> RenkoData { get; } = new()
{
    new(100), new(105), new(103), new(108), new(115),
    new(112), new(118), new(120), new(115), new(122),
    new(118), new(114), new(110), new(105), new(100)
};
Common properties
| Property | Description | Default |
|---|---|---|
ItemsSource | The collection of price data. | null |
BrickSize | The price movement required for a new brick. | 10.0 |
ValuePath | Property name for the price value. | null |
UpBrush | Color for up trends. | Green |
DownBrush | Color for down trends. | Red |