Point and figure
info
Charts are available with Avalonia Pro.
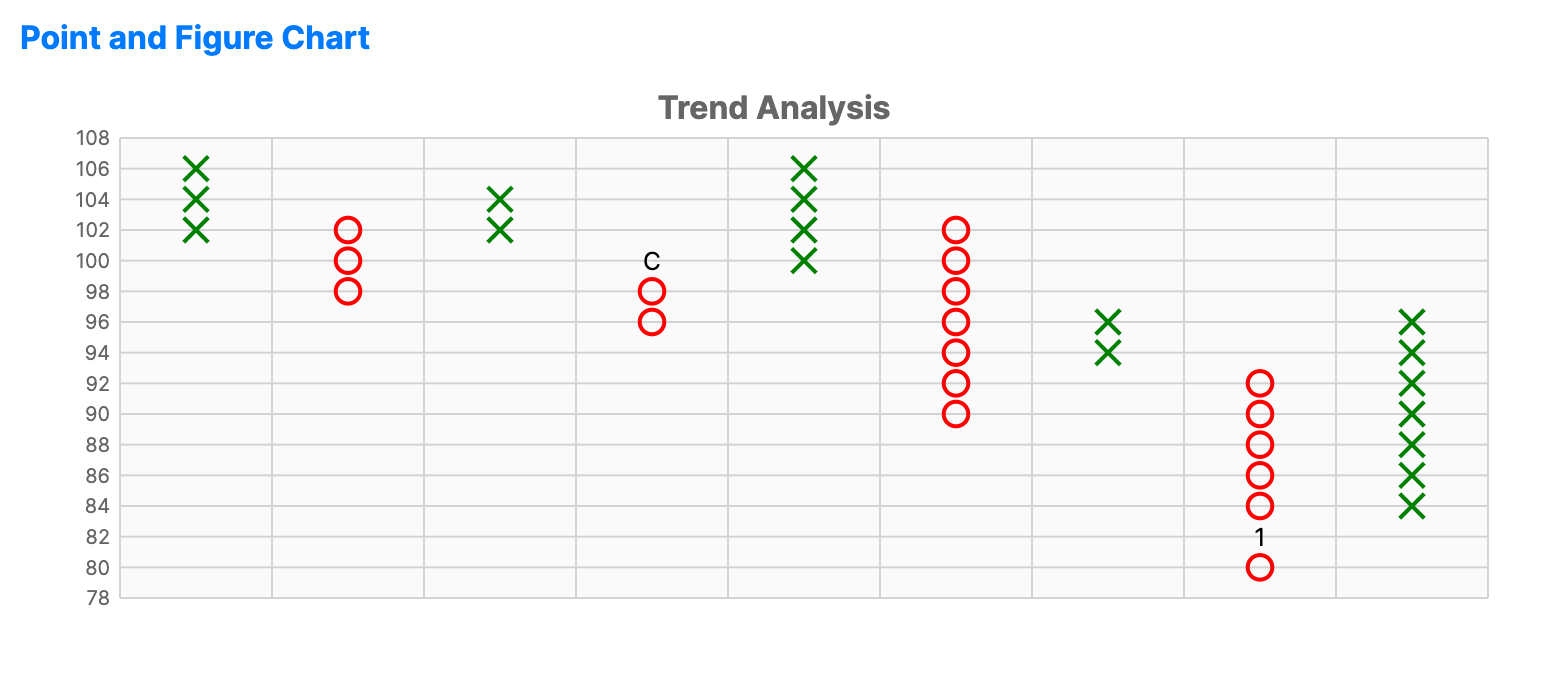
Point and Figure (P&F) charts use columns of Xs and Os to represent rising and falling prices. They filter out time and small price changes, focusing solely on pure price movement and trend reversals.
When to use
- Long-term trends: Visualizing macro-economic or multi-year market shifts.
- Support/resistance: Identifying clear supply and demand zones.
- Price targets: Using traditional P&F counting methods for price projections.
Code example
XAML
<FinancialChart xmlns="https://github.com/avaloniaui" Name="PointAndFigureChartSample" Title="Trend Analysis" Height="300">
    <FinancialChart.Series>
        <PointAndFigureSeries ItemsSource="{Binding PointAndFigureData}"
                                       HighPath="High"
                                       LowPath="Low"
                                       OpenPath="Open"
                                       ClosePath="Close"
                                       DatePath="Date"
                                       BoxSize="2.0"
                                       ReversalAmount="3" />
    </FinancialChart.Series>
</FinancialChart>
Data model (C#)
using System;

public record FinancialPoint(DateTime Date, double Open, double High, double Low, double Close);

public ObservableCollection<FinancialPoint> PointAndFigureData { get; } = new(GenerateFinancialData(100));

private static IEnumerable<FinancialPoint> GenerateFinancialData(int count)
{
    var date = DateTime.Today.AddDays(-count);
    var price = 100.0;
    var random = new Random(42);

    for (var i = 0; i < count; i++)
    {
        var open = price;
        var close = open + (random.NextDouble() - 0.5) * 5;
        var high = Math.Max(open, close) + random.NextDouble() * 2;
        var low = Math.Min(open, close) - random.NextDouble() * 2;

        yield return new FinancialPoint(date.AddDays(i), open, high, low, close);
        price = close;
    }
}
Common properties
| Property | Description | Default |
|---|---|---|
ItemsSource | The collection of price data. | null |
DatePath | Path to the date or time value used along the horizontal axis. Values can be DateTime, DateTimeOffset, or parseable date strings. | null |
HighPath | Path to the high price used to build rising columns. | null |
LowPath | Path to the low price used to build falling columns. | null |
ClosePath | Path to the close price used for starting levels and the representative value. When unset, ValuePath is used. | null |
BoxSize | The price movement represented by one X or O. Must be finite and greater than 0; extremely small values are increased internally to avoid excessive generated boxes. | 1.0 |
ReversalAmount | Number of boxes required to start a new column. Values below 1 are treated as 1. | 3 |
XBrush | Brush for the X marks. | Green |
OBrush | Brush for the O marks. | Red |
Point and figure rendering uses only source points with finite High, Low, and Close values.