Kagi chart
info
Charts are available with Avalonia Pro.
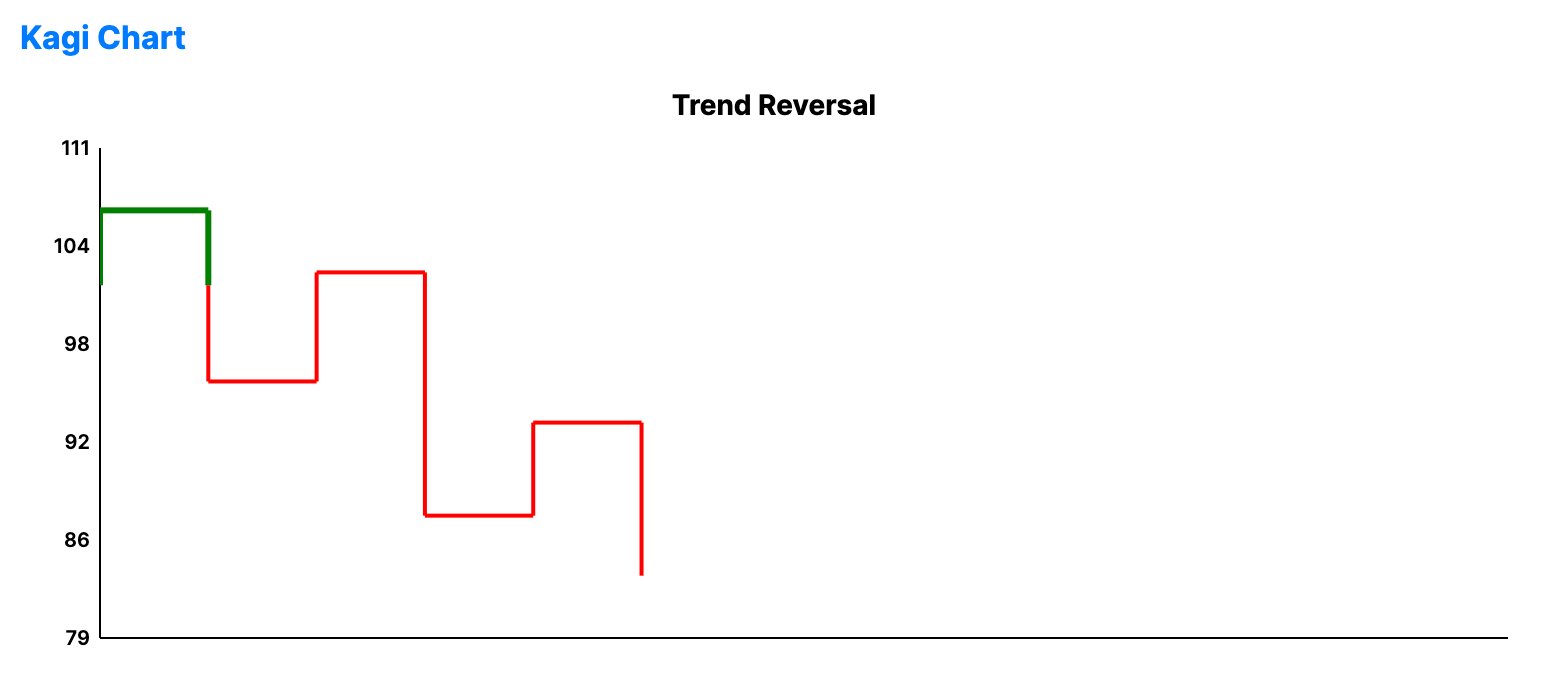
Kagi charts are time-independent charts that track price movements using vertical lines. They change direction (and line thickness) only when price reaches a certain reversal amount.
When to use
- Pure price action: Focusing on price changes regardless of time or volume.
- Breakout identification: Using the "Yang" (thick) and "Yin" (thin) lines to spot reversals.
- Following trends: Filtering out small fluctuations that don't meet the reversal threshold.
Code example
XAML
<KagiChart xmlns="https://github.com/avaloniaui" Name="KagiChartSample" Title="Trend Reversal" Height="300"
                                        ReversalAmount="4"
                                        ItemsSource="{Binding KagiData}"
                                        ValuePath="Value" />
Data model (C#)
using System;

public record KagiPoint(double Value);

public ObservableCollection<KagiPoint> KagiData { get; } = new(CreateKagiData());

private static IEnumerable<KagiPoint> CreateKagiData()
{
    var price = 100.0;
    var random = new Random(123);

    for (var i = 0; i < 100; i++)
    {
        price += (random.NextDouble() - 0.5) * 4;
        yield return new KagiPoint(price);
    }
}
Common properties
| Property | Description | Default |
|---|---|---|
ItemsSource | The collection of raw price points. | null |
ValuePath | Property representing the price. | null |
ReversalAmount | Minimum price change required to flip direction. | 1.0 |
YangBrush | Brush for the yang segments. (Rising above previous high) | Green |
YinBrush | Brush for the yin segments. (Falling below previous low) | Red |
StrokeThickness | Base stroke thickness. | 2.0 |