OHLC chart
info
Charts are available with Avalonia Pro.
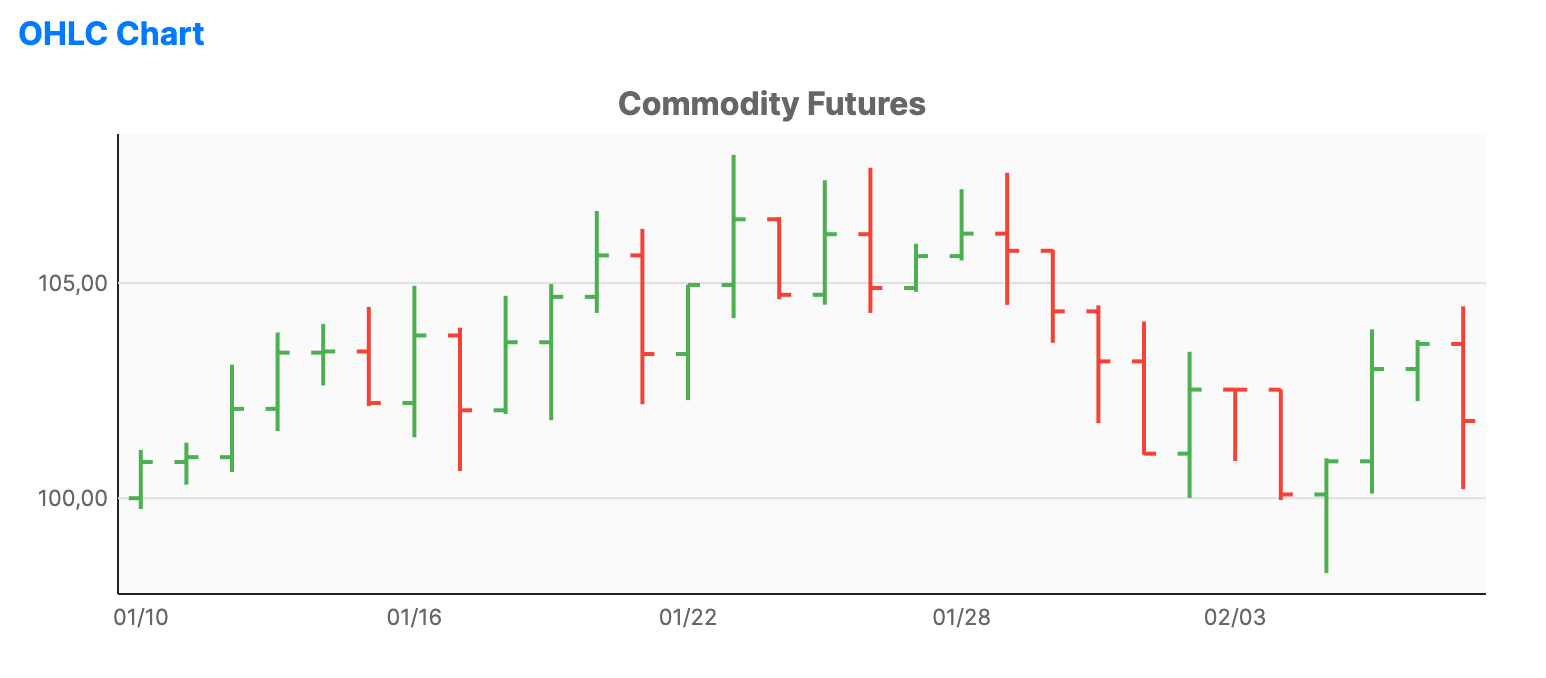
OHLC charts show the Open, High, Low, and Close prices for a given period. They are similar to candlestick charts but use vertical lines with horizontal ticks to represent the range and opening/closing prices.
When to use
- Trading analysis: Visualizing price action without the "weight" of candlestick bodies.
- Market trends: Spotting trends and price ranges over specific time intervals.
- Commodity/stock tracking: Standard professional visualization for price data.
Code example
XAML
<FinancialChart xmlns="https://github.com/avaloniaui" Name="OhlcChartSample" Title="Commodity Futures" Height="300">
    <FinancialChart.Series>
        <OhlcSeries ItemsSource="{Binding OhlcData}"
                             HighPath="High" LowPath="Low"
                             OpenPath="Open" ClosePath="Close"
                             DatePath="Date" />
    </FinancialChart.Series>
</FinancialChart>
Data model (C#)
using System;

public record FinancialPoint(DateTime Date, double Open, double High, double Low, double Close);

public ObservableCollection<FinancialPoint> OhlcData { get; } = new(GenerateFinancialData(30));

private static IEnumerable<FinancialPoint> GenerateFinancialData(int count)
{
    var date = DateTime.Today.AddDays(-count);
    var price = 100.0;
    var random = new Random(42);

    for (var i = 0; i < count; i++)
    {
        var open = price;
        var close = open + (random.NextDouble() - 0.5) * 5;
        var high = Math.Max(open, close) + random.NextDouble() * 2;
        var low = Math.Min(open, close) - random.NextDouble() * 2;

        yield return new FinancialPoint(date.AddDays(i), open, high, low, close);
        price = close;
    }
}
Common properties
| Property | Description | Default |
|---|---|---|
ItemsSource | The collection of financial data points. | null |
OpenPath | Path to the 'Open' price property. | null |
HighPath | Path to the 'High' price property. | null |
LowPath | Path to the 'Low' price property. | null |
ClosePath | Path to the 'Close' price property. | null |
DatePath | Path to the date or time value used along the horizontal axis. Values can be DateTime, DateTimeOffset, or parseable date strings. | null |
UpStroke | Outline brush for bars where Close >= Open. | #4CAF50 |
DownStroke | Outline brush for bars where Close < Open. | #F44336 |
StrokeThickness | Thickness of the lines. | 2.0 |
TickWidth | Width of the open and close tick marks in pixels. | 6.0 |