Hilo chart
info
Charts are available with Avalonia Pro.
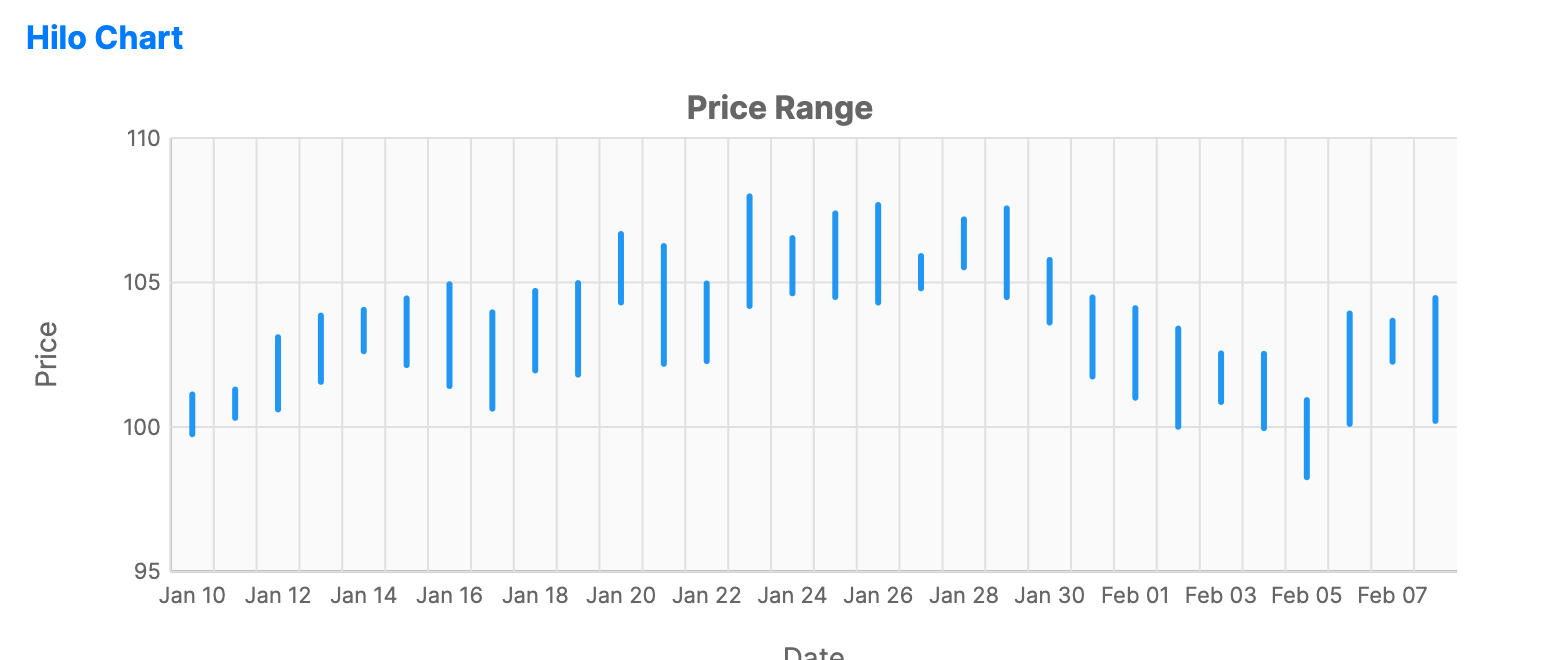
Hilo charts show the High and Low prices for a given period. By omitting the open and close values, they provide a focused view of the total price volatility and range.
When to use
- Volatility analysis: Emphasizing the spread between the highest and lowest prices.
- Support and resistance: Identifying key price levels where the market struggled to move further.
- Simplified trading: When a cleaner alternative to OHLC or Candlestick charts is preferred.
Code example
XAML
<CartesianChart xmlns="https://github.com/avaloniaui" Name="HiloChartSample" Title="Price Range" Height="300">
    <CartesianChart.HorizontalAxis>
        <DateTimeAxis LabelFormat="MM/dd" Title="Date" />
    </CartesianChart.HorizontalAxis>
    <CartesianChart.VerticalAxis>
        <NumericalAxis LabelFormat="N0" Title="Price" />
    </CartesianChart.VerticalAxis>
    <CartesianChart.Series>
        <HiloSeries ItemsSource="{Binding HiloData}"
                             HighPath="High" LowPath="Low"
                             CategoryPath="Date"
                             Stroke="#2196F3" StrokeThickness="3" />
    </CartesianChart.Series>
</CartesianChart>
Data model (C#)
using System;

public record FinancialPoint(DateTime Date, double Open, double High, double Low, double Close);

public ObservableCollection<FinancialPoint> HiloData { get; } = new(GenerateFinancialData(30));

private static IEnumerable<FinancialPoint> GenerateFinancialData(int count)
{
    var date = DateTime.Today.AddDays(-count);
    var price = 100.0;
    var random = new Random(42);

    for (var i = 0; i < count; i++)
    {
        var open = price;
        var close = open + (random.NextDouble() - 0.5) * 5;
        var high = Math.Max(open, close) + random.NextDouble() * 2;
        var low = Math.Min(open, close) - random.NextDouble() * 2;

        yield return new FinancialPoint(date.AddDays(i), open, high, low, close);
        price = close;
    }
}
Common properties
| Property | Description | Default |
|---|---|---|
ItemsSource | The collection of price data. | null |
HighPath | Path to the maximum price property. | null |
LowPath | Path to the minimum price property. | null |
CategoryPath | Path to the date/category property. | null |
Stroke | Color of the vertical range lines. | Theme-dependent |
StrokeThickness | Width of the price lines. | 2 |