Error bar chart
info
Charts are available with Avalonia Pro.
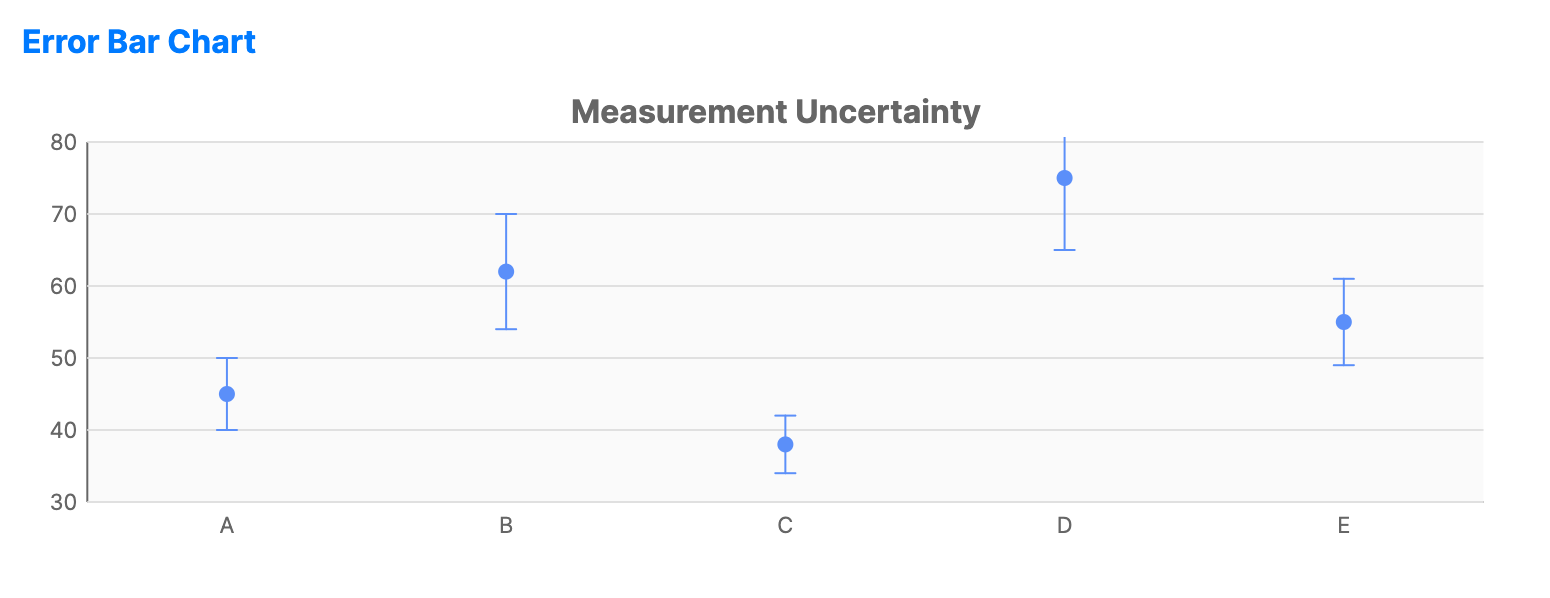
Error bar charts represent the variability of data and are used on graphs to indicate the error or uncertainty in a reported measurement.
When to use
- Scientific research: Visualizing standard deviation or confidence intervals.
- Quality control: Showing the range of tolerance in manufacturing.
- Survey data: Indicating the margin of error in statistical polls.
Code example
XAML
<CartesianChart xmlns="https://github.com/avaloniaui" Name="ErrorBarChartSample" Title="Measurement Uncertainty" Height="250">
    <CartesianChart.HorizontalAxis><CategoryAxis /></CartesianChart.HorizontalAxis>
    <CartesianChart.VerticalAxis><NumericalAxis /></CartesianChart.VerticalAxis>
    <CartesianChart.Series>
        <ErrorBarSeries Title="Measurements"
                                 CategoryPath="Sample"
                                 ValuePath="Value"
                                 ErrorPath="Error"
                                 CapWidth="10"
                                 ShowMarkers="True"
                                 MarkerSize="8"
                                 ItemsSource="{Binding ErrorBarData}" />
    </CartesianChart.Series>
</CartesianChart>
Data model (C#)
public record ErrorBarItem(string Sample, double Value, double Error);

public ObservableCollection<ErrorBarItem> ErrorBarData { get; } = new()
{
    new("A", 45.0, 5.0),
    new("B", 62.0, 8.0),
    new("C", 38.0, 4.0),
    new("D", 75.0, 10.0),
    new("E", 55.0, 6.0)
};
Common properties
| Property | Description | Default |
|---|---|---|
ItemsSource | The collection of measured data. | null |
ValuePath | The central value (Mean/Median). | null |
ErrorPath | Symmetric error amount applied above and below the value. | null |
LowErrorPath | Lower error amount for asymmetric error bars. | null |
HighErrorPath | Upper error amount for asymmetric error bars. | null |
ErrorMode | Whether to draw the error bar above, below, or on both sides of the value. | Both |
CapWidth | The width of the horizontal caps on the error bars. | 8 |
ShowMarkers | Whether to draw a marker at each central value. | false |
MarkerSize | Size of the central marker. | 8 |
Stroke | Color of the error indicator lines. | Theme-dependent |