Radar chart
info
Charts are available with Avalonia Pro.
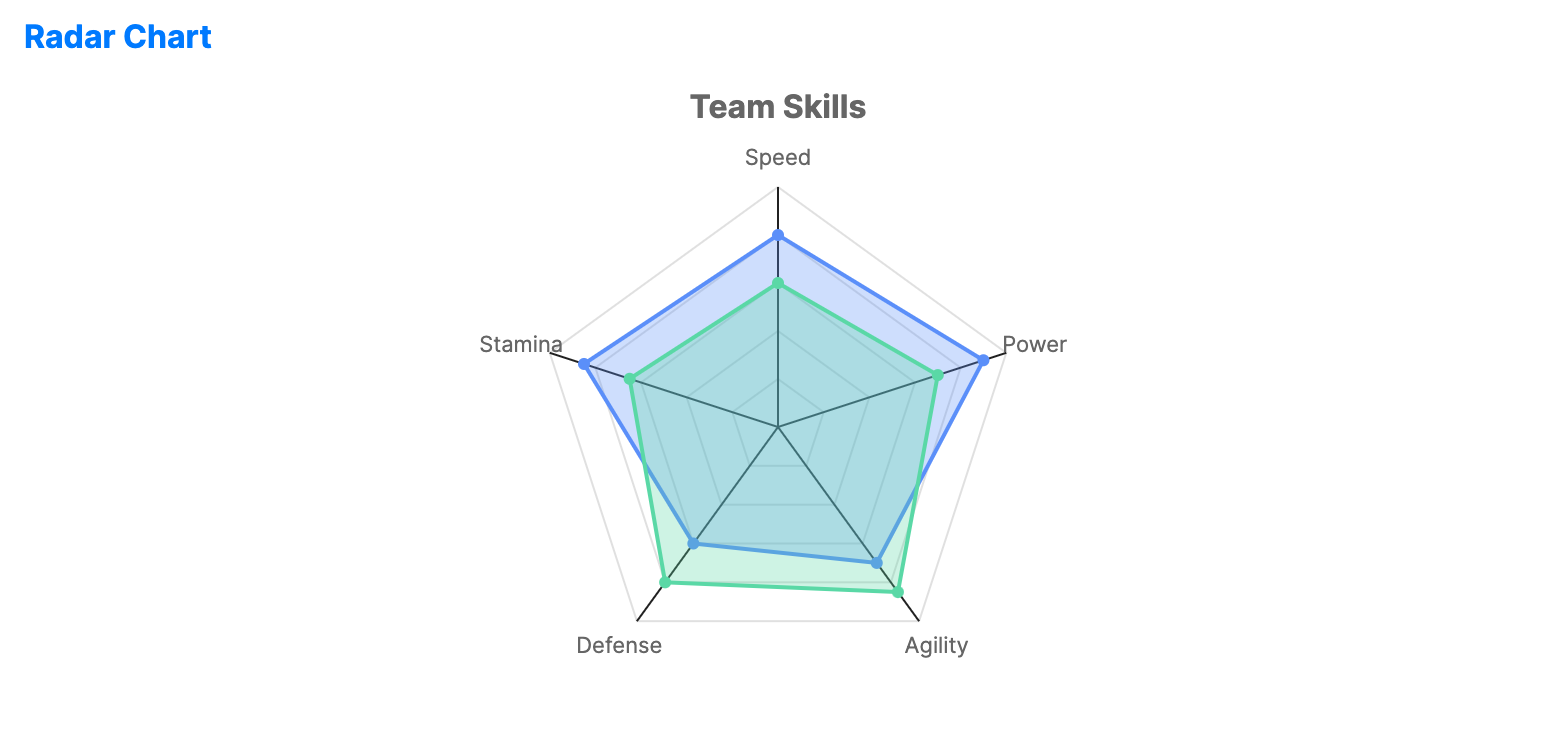
Radar charts compare multiple qualitative variables across several categories. They are widely used to visualize "profiles" or signatures of different entities across common metrics.
When to use
- Skill assessment: Comparing the strengths/weaknesses of employees or athletes.
- Product benchmarking: Comparing different products across price, quality, and features.
- Performance profiles: Displaying multifaceted metrics (e.g., SEO, Speed, Security for a website).
Code example
XAML
<RadarChart xmlns="https://github.com/avaloniaui" Name="RadarChartSample" Title="Team Skills" Height="350" IsTooltipEnabled="True"
                                         AxisLabels="{Binding RadarLabels}">
                        <RadarChart.Series>
                            <RadarSeries Title="Player A" ItemsSource="{Binding RadarSeries1}" FillOpacity="0.3" ShowMarkers="True" />
                            <RadarSeries Title="Player B" ItemsSource="{Binding RadarSeries2}" FillOpacity="0.3" ShowMarkers="True" />
                        </RadarChart.Series>
                     </RadarChart>
Data model (C#)
// Axis labels mapped to categories
public ObservableCollection<string> RadarLabels { get; } = new()
{
    "Speed", "Power", "Agility", "Defense", "Stamina", "Technique"
};

// Values for the axes in order
public ObservableCollection<double> RadarSeries1 { get; } = new() { 80, 90, 70, 60, 85, 75 };
public ObservableCollection<double> RadarSeries2 { get; } = new() { 60, 70, 85, 80, 65, 90 };
Common properties (RadarChart)
| Property | Description | Default |
|---|---|---|
AxisCount | Number of axes shown around the chart. | 5 |
ShowGridLines | Whether to draw the concentric radar grid. | true |
GridLevels | Number of concentric grid levels. | 5 |
AxisLabels | Labels displayed for each axis. | null |
IsHighlightEnabled | Enables chart-level hover highlighting for radar points. | false |
Common properties (RadarSeries)
| Property | Description | Default |
|---|---|---|
ItemsSource | The numerical values for the radar axes. | null |
Title | The name of the player/entity (for legend). | null |
MaxValue | Maximum value used to scale the series. | 100.0 |
Fill | Brush used for the polygon area. When null, the chart uses the series palette brush and applies FillOpacity. | null |
Stroke | Brush used for the polygon border. When null, the chart uses the series palette brush. | null |
FillOpacity | Opacity applied to the filled polygon area. | 0.3 |
ShowMarkers | Toggles points at the axis intersections. | true |
MarkerSize | Size of the markers at the axis intersections. | 6 |