Metrics tool
Metrics are numerical measurements reported over time. They are typically used to monitor the health of an app and generate alerts.
Meter providers were introduced with .NET 6.
There are four main types of metric instruments:
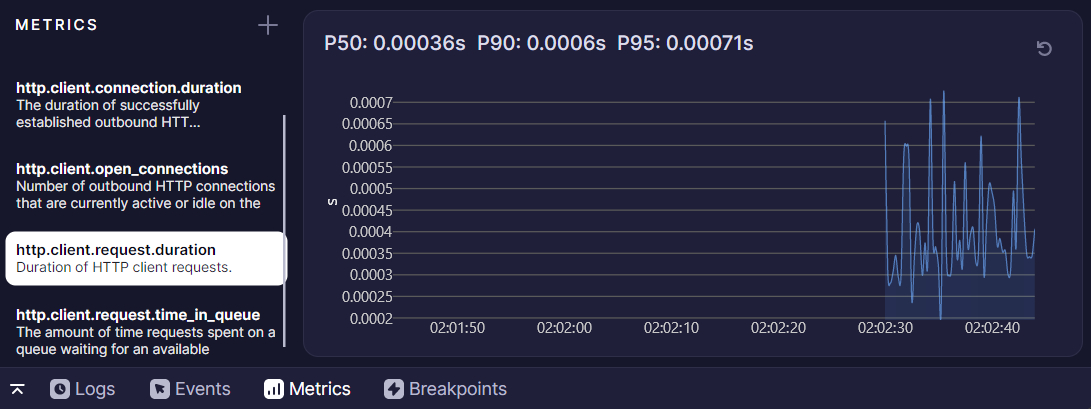
Counter- a measurement representing a single value that can only grow. Typically representing "total" values, like total raised exceptions count.UpDownCounter- similar to Counter, but allowing negative increments. For example, Memory Working Set.Histogram- distribution of measurements. Frame render or HTTP request duration is an example.Developer Toolsalso displays useful P50 (median), P90 and P95 percentiles for histograms.Gauge- a measurement without historical data. Only displays latest value. Not supported byDeveloper Toolsat the moment.
Disabling/enabling default sources
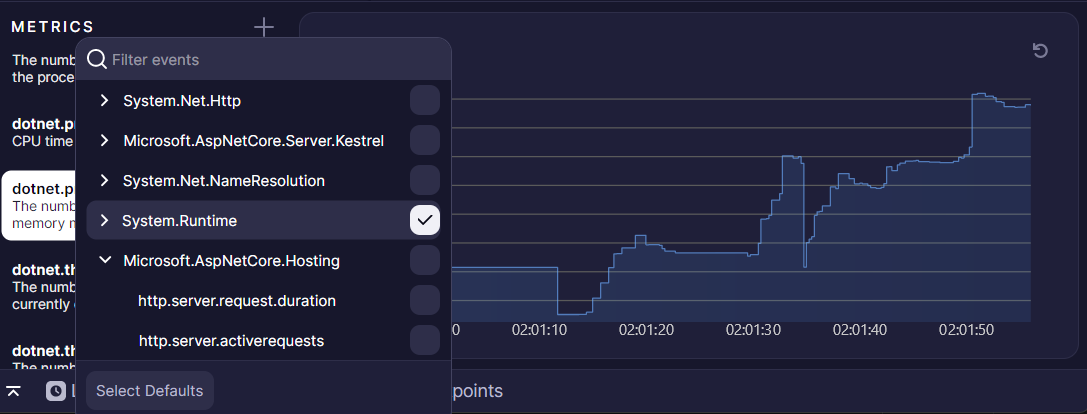
By default, the Developer Tools are configured to only accept Avalonia and System.Runtime meter providers.
It's possible to disable them or enable another by clicking the + button. All instruments are grouped by their meter provider, typically a namespace defining name.
Keep in mind, this list is dynamic. New instruments are added only when provider has pushed at least single measurement. For example, HttpClient (System.Net.Http namespace) instruments will be displayed only after the first request.
Avalonia meters are available from 11.3.0, and System.Runtime only from .NET 9.
If your application meets neither of these requirements, the list of meters is empty.
Writing custom metric sources
You can follow .NET Creating metrics documentation on how to write custom metric sources which then can be previewed in the Developer Tools or the official dotnet-counters console tool.
static Meter s_meter = new Meter("SimpleToDoList");
static UpDownCounter<int> s_tasksCount = s_meter.CreateUpDownCounter<int>("tasks.count");
static Counter<int> s_tasksResolved = s_meter.CreateCounter<int>("tasks.resolved.total");

private void OnTaskAdded() => s_tasksCount.Add(1);
private void OnTaskRemoved() => s_tasksCount.Add(-1);
private void OnTaskResolved() => s_tasksResolved.Add(1);
Once code has pushed at least one measurement, this SimpleToDoList will be visible in the + button flyout to be displayed in the tool.