Breakpoints tool
The Application Breakpoints Tool allows you to monitor and debug property changes and events in Avalonia applications without modifying code. Breakpoints can be set on properties, events to help diagnose issues and understand application behavior.
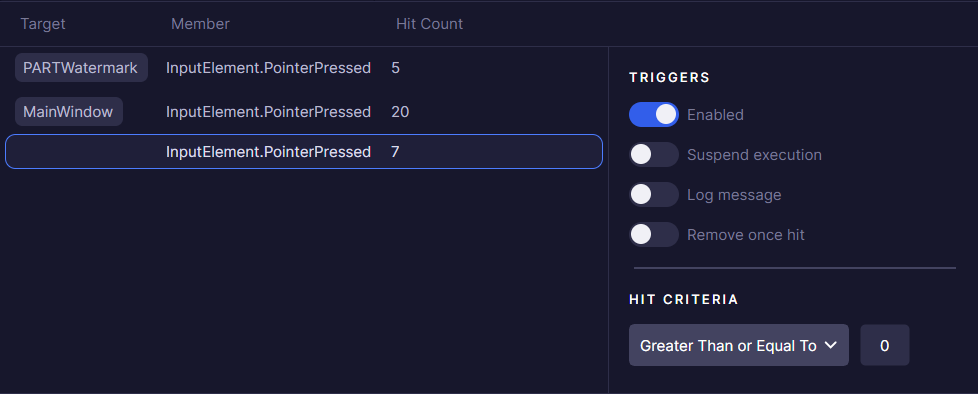
A breakpoint considered to be Hit (and correspondingly, increment Hit Count value, or suspend execution) when:
- Property is changed (for property breakpoints) or event is raised (for event breakpoints).
- Breakpoint is enabled.
- If breakpoint has a target, it matches source of the property/event.
- Hit count criteria is satisfied.
Depending on how breakpoint was created, it might have Target assigned to it. For example, event breakpoints without target are considered global, and are triggered when any element has this event raised.
Adding breakpoints
Adding a property breakpoint
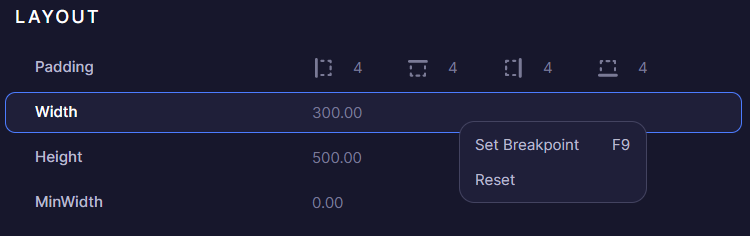
On the Properties list each dependency property has a Set Breakpoint context menu item.
Created breakpoint is bound to the element on which it was set.
Adding an event breakpoint
On the Events tool each raised event has an option to set a breakpoint.
Setting On a Source will bind breakpoint to the source element this previously raised event had. Alternatively, the Globally option will create an unbound breakpoint, which gets hit on any element with this event.
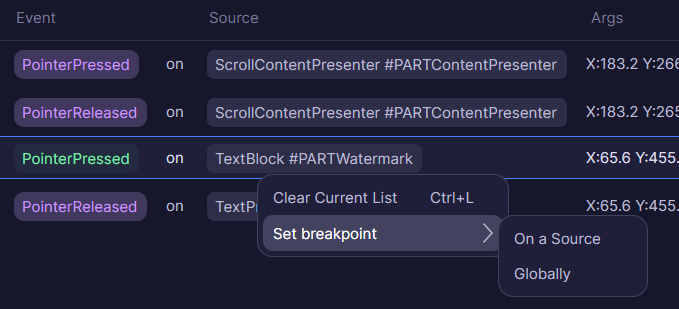
It's also possible to set a breakpoint bound to a specific routed chain element. Or from the "Event Listeners" flyout.

Managing breakpoints
By default, any breakpoint only increments Hit Count, when it's triggered.
There are several other options that can be enabled:
Suspend execution
Similar to how breakpoints work in a typical IDE, stopping execution and navigating you to the breakpoint location.
This option is primarily useful, when there is a need to see what exactly triggered property change or an event. By reading stacktrace in the IDE.
Connected application must have a third-party Debugger attached. Otherwise this breakpoint is ignored.
Since Developer Tools uses standard Debugger.Break() method, any conventional IDE with a debugger will work: Visual Studio, Rider or VSCode.
Unfortunately, there is no clean way to override breakpoint Stacktrace, because of that IDE might show internal code from the Debugger.Break location.
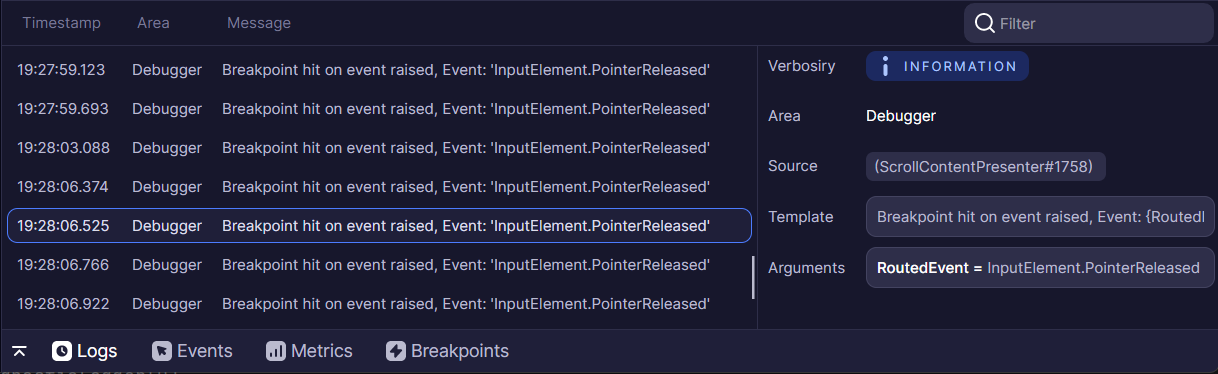
Log message
When enabled, breakpoint will write a log message into Logs tool.
Remove once hit
As the name suggests, breakpoint is removed once it is hit. Can be combined with other options.