Developer Tools
Avalonia has a built-in DevTools window which is enabled by calling the attached AttachDevTools() method in a Window constructor. The default templates have this enabled when the program is compiled in DEBUG mode:
public partial class MainWindow : Window
{
    public MainWindow()
    {
        InitializeComponent();
    }
}

// in auto-generated by Avalonia.NameGenerator MainWindow.g.cs:
partial class MainWindow
{
    // ...
    public void InitializeComponent(bool loadXaml = true, bool attachDevTools = true)
    {
        // ...
#if DEBUG
        if (attachDevTools)
        {
            this.AttachDevTools();
        }
#endif
        // ...
    }
}
To open the DevTools, press F12, or pass a different Gesture to the this.AttachDevTools() method.
From release 0.10 to use DevTools, you must add Avalonia.Diagnostics nuget package.
dotnet add package Avalonia.Diagnostics --version 0.10.0
-115226bedb308a9187a13e8cfc55f159.png)
There is a known issue when running under .NET core 2.1 that pressing F12 will cause the program to quit. In this case, either switch to .NET core 2.0 or 3.0+ or change the open gesture to something different, such as Ctrl+F12.
Logical and Visual Trees
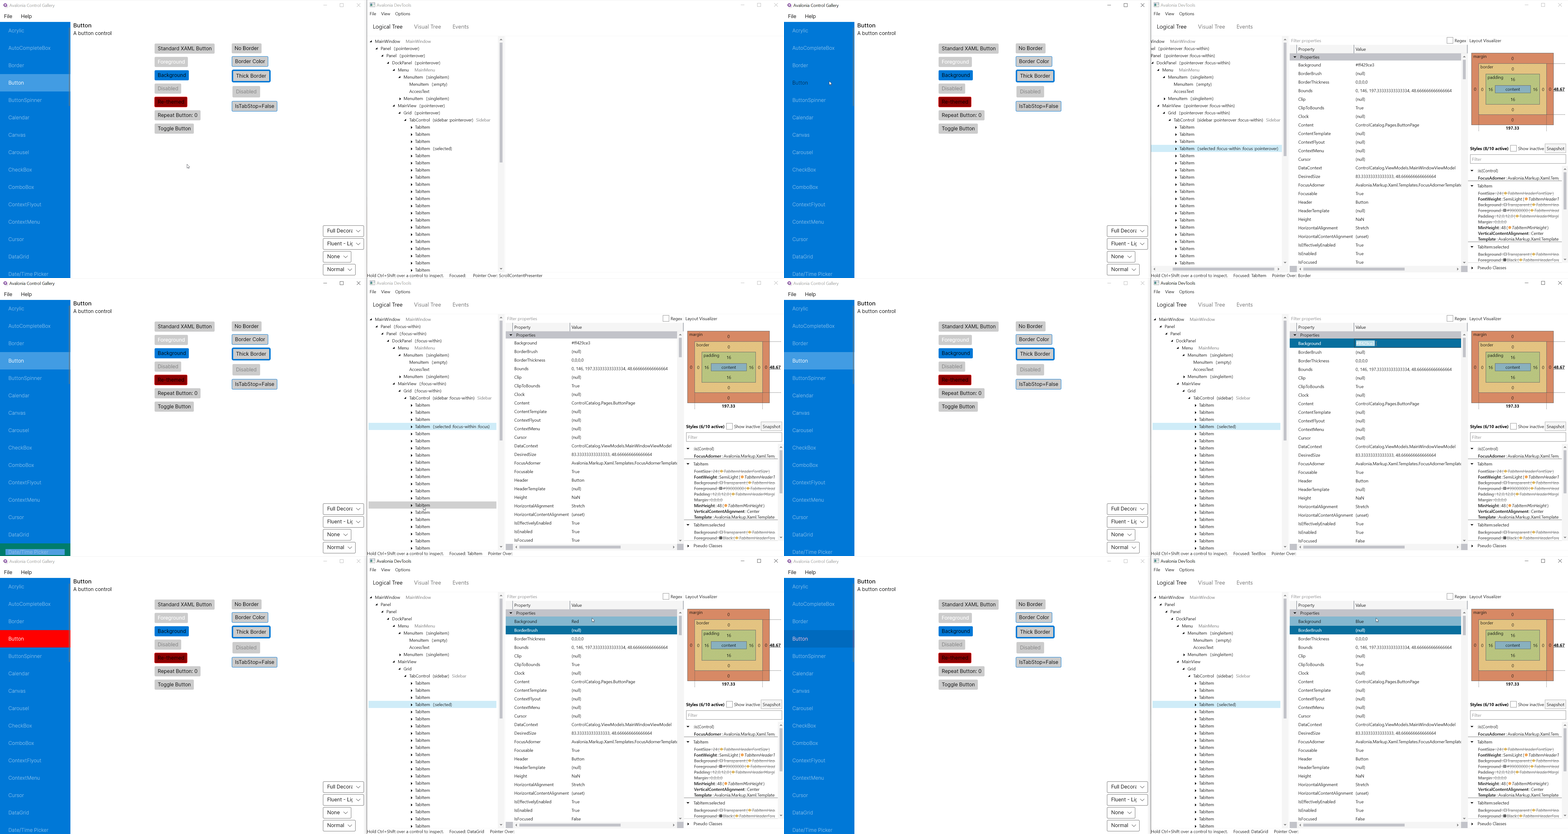
The Logical Tree and Visual Tree tabs display the controls in the window's logical and visual trees. Selecting a control will show the properties of that control in the right-hand pane where they can be edited.
Properties
Allows for quickly checking and editing properties of the control. One can also search for properties (by name or by using a regex).
| Column | Description |
|---|---|
| Property | Name of the property |
| Value | Current value of the property |
| Type | Type of the current value |
| Priority | Priority of the value |
-8965d47b515f6db827093a55314503b8.png)
Layout
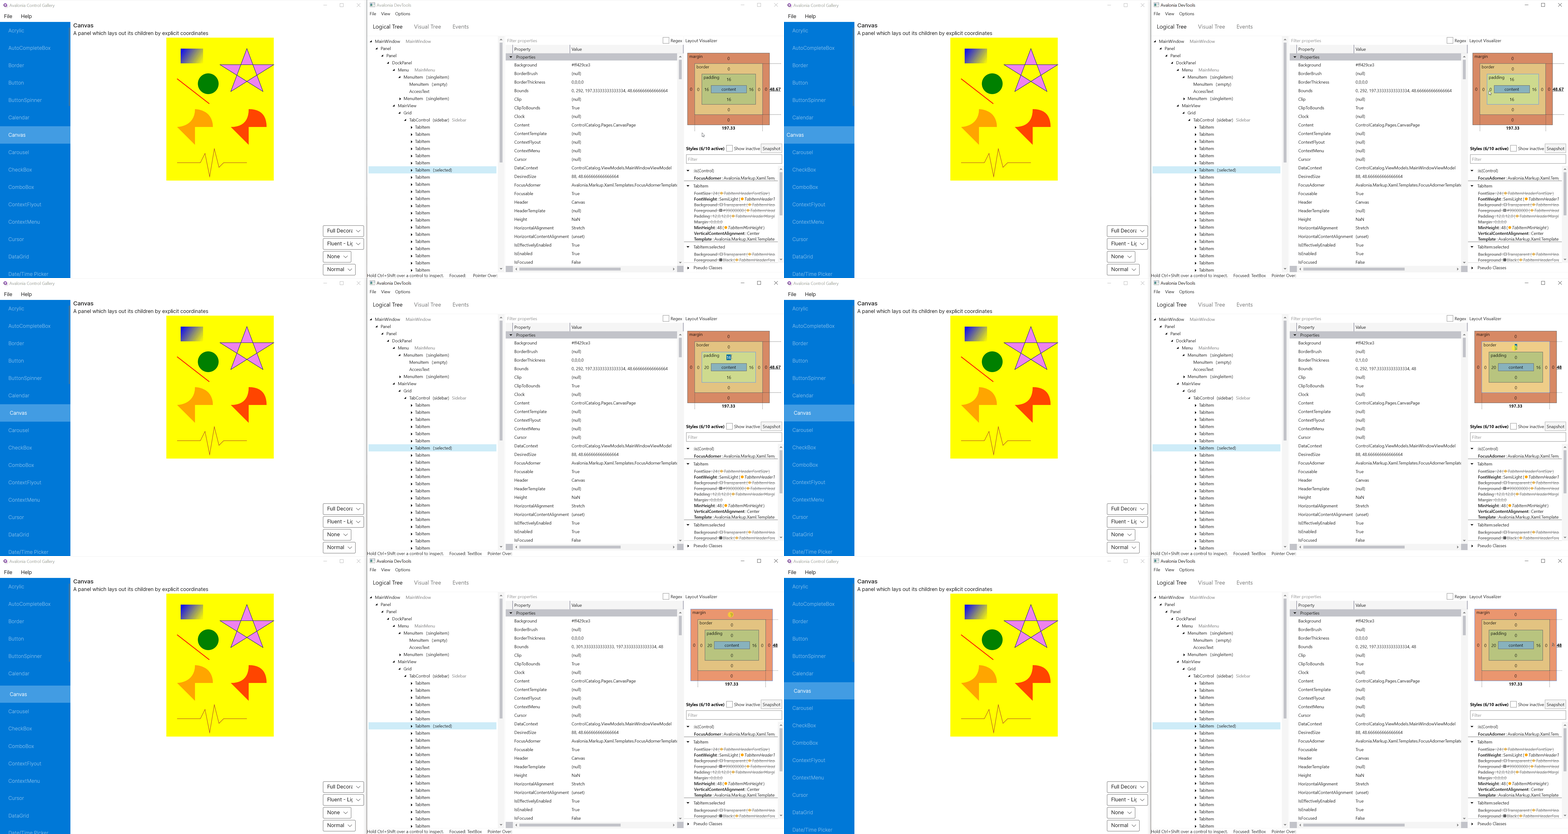
Allows for inspecting and editing of common layout properties (Margin, Border , Padding).
Control size and size constraints are also shown.
If Width or Height are underlined that means there is an active constraint. Hover over the value to see a tooltip containing relevant information.
Styles
While properties panel shows currently active values of properties, styles panel shows all values and origin of the value.
Additionally one can see all styles that could potentially match this control (by toggling Show inactive option).
Current styles can be snap-shotted by either pressing the Snapshot button or pressing Alt+S while hovering over the target window. Snap-shotting means that styles panel won't update to reflect new state of the control. This is especially useful when troubleshooting problems with :pointerover or :pressed selectors.
If setter value is bound to a resource it will be indicated by a circle followed by the resource key.
-86c8078e0b42ed6620724299e6702d48.png)
If given value has a strikethrough it means that it is being overridden by a value in style with higher priority.
-c217d71d1c9af69eae7f0c170f31f99d.png)
Setters have a context menu that allows for quickly copying names and values to the clipboard.
Events
The events tab can be used to track the propagation of events. Select the events to track in the left pane, and all events of that type will be shown in the center upper pane. Select one of these events to see the event route.
Dotted underline under event name or control type indicates that quick navigation is possible.
- Double clicking an event type will select and scroll to the given event type
- Double clicking a control type (and/or name) will navigate to the visual tree tab and select said control.
-f057b3c930b7767290576120261437f5.png)
Console
The console can be shown using the "View" → "Console" menu. The console implements a C# REPL which can be used to run arbitrary C# code. In a console session, the following predefined variables are available:
help: Displays a help messagee: The control currently selected in the logical or visual treeroot: The root of the visual tree
Hotkeys
| Keys Combination | Function |
|---|---|
| Alt+S | Enable Snapshot Styles |
| Alt+D | Disable Snapshot Styles |
| CTRL+Shift | Inspect Control over Pointer |
| CTRL+Alt+F | Toggle Popup freeze |
Examples
Changing a property value

Changing layout properties
